According to online real estate portal Zillow’s monthly Buyer-Seller Index, released last week, the Chicago metro area continues to tilt toward the buyer despite a rate of annual home appreciation higher than the national average—6.9 percent versus 6.6 percent nationally. Chicago finds itself in the company of many other Midwestern and Northeastern metros, while the stronger sellers’ markets congregate on the West Coast. While designed for intercity comparison, Zillow also dished out their findings for Chicago neighborhoods, so I could get a read on bargaining power at the local level.
“It’s not a hard and fast rule, but in buyers’ markets there is a general association with a slower economy,” says Skylar Olsen, a Zillow Economist involved in producing the report. “While in sellers’ markets consumer confidence and real estate activity is usually more robust with more bidding and higher prices.”
The rankings for buyers and sellers markets aren’t concerned with home values, but rather the activity and mobility within a place, and thus the trajectory of the market. Here are the top five for each:
The Top Seller's Markets
|
Rank
|
Neighborhood
|
Sale to List Price
Ratio |
Percent of Recent Listings
with a Price Cut |
Buyer/Seller Index
|
|---|---|---|---|---|
| 1 | Near West Side | 1.00 | 33.8 | 0.26 |
| 2 | Logan Square | 0.99 | 30.9 | 0.51 |
| 3 | River North | 1.00 | 39.1 | 0.77 |
| 4 | East Village | 0.98 | 36.8 | 1.03 |
| 5 | West Lawn | 0.99 | 33.3 | 1.28 |
Four of the five top seller’s markets locally are considered by-and-large to be trendy neighborhoods with sharply appreciating real estate (West Lawn being the exception). The supply is no match for demand in these areas, and rents are also very high. These factors are bearing down on for-sale housing, contributing to rapid sales at or above asking prices. According to Zillow’s numbers, the Near West Side and River North had closed sales prices on average just above list prices. As a normal occurrence, that’s pretty remarkable. The other top sellers’ markets were just behind with Logan Square’s sales prices 0.9938% of list prices.
The other indices used in the report are days on the market and the percentage of recent listings with a price cut. Sellers in Garfield Ridge suffer through 173 days on the market, on average, while back in Logan Square the average list time is 102 days. If you’re peddling a single-family home close to a boulevard in Logan Square, says real estate agent Kim Kerbis of @properties, expect to dramatically outperform the average. “A listing I watched at 2630 North Richmond [Street], a freestanding three-bed, had a parade of people coming through it every day until it went under contract in a week. It had multiple offers and sold for $35,000 above ask.”
A routine practice of listing agents in appreciating neighborhoods is to price a home slightly below market value, “triggering a little bit of that old fashioned eBay mentality…. Buyers who know the market will come in higher from the get-go,” says Kerbis. As for other sellers’ neighborhoods, she could only confirm they are mostly very hot and happening areas. “East Village was rocking this spring and summer.”
The Top Buyer's Markets
|
Rank
|
Neighborhood
|
Sale to List Price
Ratio |
Percent of Recent Listings
with a Price Cut |
Buyer/Seller Index
|
|---|---|---|---|---|
| 1 | Beverly | 0.97 | 48.9 | 10 |
| 2 | Garfield Ridge | 0.96 | 37.4 | 9.74 |
| 3 | Gold Coast | 0.97 | 41.4 | 9.49 |
| 4 | Streeterville | 0.97 | 42.5 | 9.23 |
| 5 | Lakeview East | 0.97 | 47.0 | 8.97 |
On the buyer’s side we see well-established neighborhoods, three of them on the prosperous North Side lakefront. Home value and pricing in Gold Coast, Streeterville, and Lakeview East had really ballooned in the years leading up to the recession. With modest recovery, you’re starting to see sellers flocking back to the market with confident asking prices. But evidence of prematurity shows up in listing history and price cuts, as the average stay on the market still pushes into four and five months in these areas and price cuts have occurred in close to half of recent listings (whereas in strong sellers’ markets it’s around one-third).
Kerbis offers that variation in housing style within a neighborhood can affect overall sales performance, making it appear from the outside that the buyer has the advantage. “You can walk down a Lakeview street and there are 20 different housing styles. Each has its own ecosystem.” Deals can be found on lakefront condos, for instance, but most belong to less desirable buildings with fewer and older amenities.
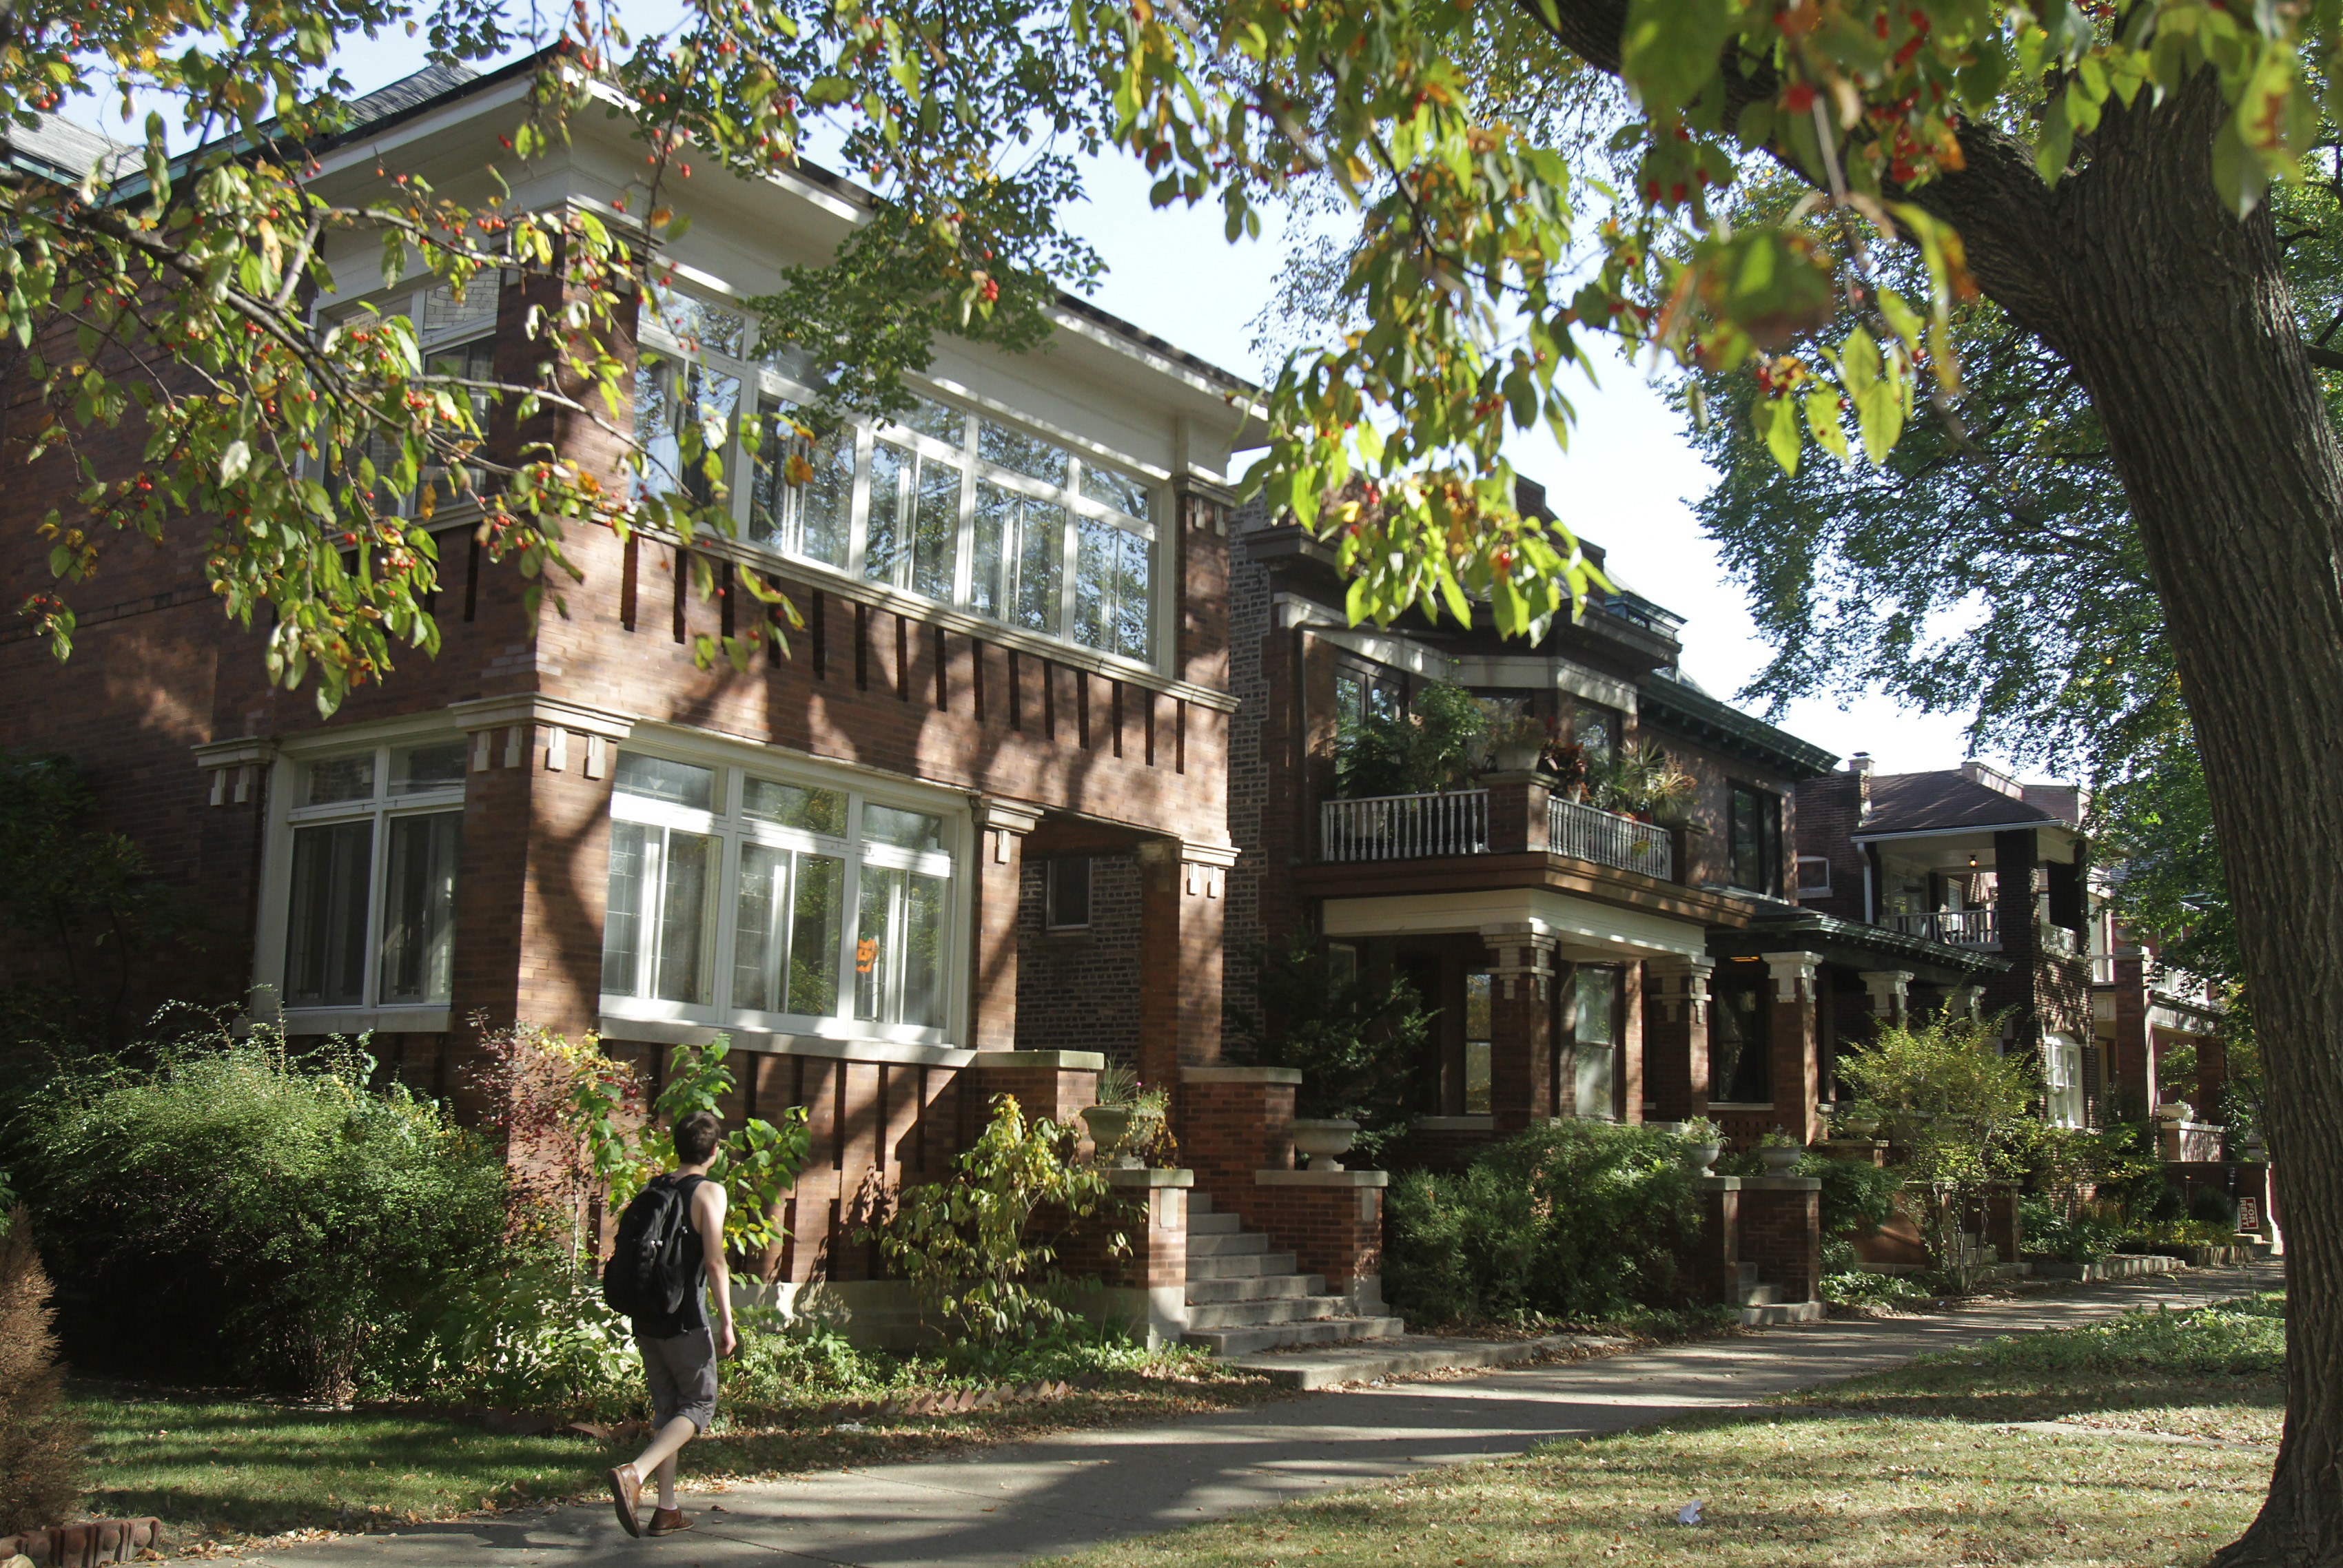
Beverly is Zillow’s top buyer's market. Home prices are low in this bucolic far Southwest neighborhood, compared with the North Side lakeshore, but higher than immediate neighbors Morgan Park, Washington Heights, and Auburn Gresham. The Metra provides quick but infrequent service downtown and we don’t have to tell you that driving a dozen miles north is a nuisance. Furthermore, while the Catholic schools in Beverly are legendary, the local public schools garner less uniform praise. For some, it may be worth hopping the city line into Evergreen Park. For others, despite the amazingly large classic housing stock, it just isn’t worth the schlep.
Want to get a foothold in a hot seller-driven neighborhood? Your best strategy might be to wait until late November. No matter where you’re looking, the period from Thanksgiving through the Super Bowl is real estate’s slow season.