 |
If far from the best of times, neither was it the worst of times on the local real-estate scene. Although it took longer to sell a house and profit margins were generally smaller than a year ago, homes continued to sell, defying the glum mutterings of some discouraged sellers. “The entire market is not in the toilet,” says Thaddeus Wong, the head of the Chicago real-estate agency @properties. “But a lot of sellers like to point to [the market’s collapse] as an excuse when their house is not selling.”
The charts provide a comprehensive dissection of the cooling market in house sales in Chicago and the six-county metro area. In Chicago’s 11th annual look at the region’s real-estate sales, this is the first time our charts—compiled using data supplied by the Multiple Listing Service of Northern Illinois (MLSNI)—have reported widespread drops in all three major indicators: house prices, number of houses sold, and days on the market.
Let’s begin with the most significant number: prices. Average prices of single-family homes fell in almost one-third of the city neighborhoods and suburbs tracked by the chart. Factor in those areas where prices stayed flat or nearly flat—that is, with an increase of less than 2 percent—and the figure rises to include more than half of all the 281 neighborhoods and suburbs. What’s more, compared with last year, in nine out of ten areas, fewer homes sold during the 12-month period covered by the chart, July 1, 2006, to June 30, 2007. And in almost as many areas, homes this year spent more time on the market before selling than they did last year.
In Chicago, 25 of the city’s 77 neighborhoods saw house prices take a downturn. The once-hot Lincoln Square—where average house prices topped the $1-million mark for the first time last year—took a significant hit, with house prices dropping by 32 percent. Sales of condos and townhouses—what the MLSNI classifies as attached housing—did remain steady there.
But it is important to add a little perspective: As with most other neighborhoods and suburbs, Lincoln Square still shows substantial appreciation in the value of homes since 1994: 331 percent. In fact, as the chart demonstrates, even with recent downturns, most Chicago neighborhoods have experienced triple-digit increases since 1994—which is why many analysts are referring to the current market shakeup as a “correction,” a paring back of house prices to more realistic levels.
There were a few bright spots in the city. A number of up-and-coming neighborhoods, such as Logan Square, showed double-digit increases since last year, as did several South Side neighborhoods, including Beverly, Bridgeport, and Pullman. Though prices fell by 8.44 percent in the Loop, the neighborhoods bordering downtown did well. The Near West Side led all neighborhoods and suburbs with a 72.55 percent increase in the price of single-family (or detached) homes, albeit with only 36 sales. (By comparison, nearby West Town had 158 sales and a very healthy 18 percent increase.) The Near North, South, and West sides saw attached-housing sales remain steady, with more than 6,500 sales of condos and townhouses. Prices rose as well, with the Near North Side leading the way with a nearly 11 percent upswing.
“We’ve had a sustained demand for condos, and I think we will continue to see some upward movement there,” says Gail Lissner, a vice president with Appraisal Research Counselors, the Chicago-based real-estate consultants. She attributed some of the gains experienced by condos to the simple fact that there has been “a lot of new construction,” while noting that some of this year’s condo sales “may have gone under contract last year.” Lissner expressed surprise at the lower average sale price in the Loop. “That’s a very strong market,” she insisted.
In the suburbs, no consistent patterns emerged. At the upper end—that is, where average house prices exceeded $1 million—five towns saw prices drop (Glencoe, Kenilworth, Northfield, Oak Brook, and Winnetka), while three saw them rise (Burr Ridge, Hinsdale, and Lake Forest; with only eight sales between them, pricey Bannockburn and Mettawa did not have enough sales for us to provide a percentage increase). Of course, a few high-end sales can give any suburb’s average house price a significant boost: Highland Park, for instance, had the top two house sales in the region over the past 12 months, giving the average price in that suburb a boost of nearly $100,000 and a price increase of 15 percent. (See Deal Estate, “Declining Fortunes.”) Without those two sales, the annual increase for the town would have been only 6.2 percent.
In the southern suburbs, a cluster of lower-end towns showed a nice bump: Dixmoor (a 21 percent increase), Phoenix (28.74), and Steger (16; the average house price among all three of those suburbs was $116,434). The suburban leader was horsy Wayne (just east of the Fox River), with a 23.77 percent price increase; in McHenry County just south of the Wisconsin border, Hebron had the biggest suburban decrease: 26.06 percent.
Illustration: Heads of State
The surprise might be that homes managed to get sold at all, what with all the worry about oversupply of new houses and condos; rising numbers of foreclosures on subprime and, later, conventional mortgages; higher interest rates that made it harder to buy; and an economy that can’t decide which way to go. Those aren’t doomsday factors, but they do help explain why many likely home sellers held their properties off the market; why many buyers figured they could snag a bargain; and why Chicken Littles everywhere were talking about a catastrophic real-estate market.
The sellers of a house on Montana Street in Lincoln Park experienced firsthand the changing climate of Chicago’s real-estate market. They had priced their house at $2.295 million—which had been the asking price when they bought the place four years earlier. This past April the house did sell, but for $140,000 less than it had four years earlier.
In some cases, the downturn affected condos as well. In Rogers Park, Don O’Carroll, a Chicago cop, and his girlfriend, Cindy Clarke, a Century 21 Sussex & Reilly real-estate agent, spent the summer confounded by their failure to unload any of the six condos O’Carroll built on Farwell Avenue. “We’ve had three price reductions,” Clarke said after the condos had lingered on the market for five months. “We’re down about $70,000 on each unit.” The condos are housed in a new brick building with at least one balcony for each unit; each unit features Bosch kitchen appliances and energy-saving windows. Prices, cut to between $219,000 and $415,000, are in the upper range for the neighborhood, but not out of reach—yet the only unit that was occupied by late summer was the one Clarke and O’Carroll had reluctantly moved into.
Clarke hosted open houses almost every weekend, threw a soiree for real-estate agents that didn’t shut down until nearly midnight, raffled off a digital camera, handed out Champagne. Nothing worked. “I’m baffled,” she said. “Our next step is to rent these babies out.”
They started with prices that turned out to be overly optimistic—a range of $369,000 to $485,000—but in that, Clarke and O’Carroll weren’t at all unusual. Reductions from original asking prices became the norm this year, as sellers incrementally scaled down their hopes to match the prevailing reality. In June, Chicago found that one of three houses sold in the region moved only after having at least one price reduction.
Bennetta Kelly and her husband did a reality check when their Lincoln Park townhouse wouldn’t move this spring. From their initial asking price—what they thought it would have brought at the top of the market a few years ago—they cut 5 percent, and they soon sold it for another 5 percent below that. “You had to be willing to listen to the buyer,” Kelly says.
Gloria Matlin, a top-selling Coldwell Banker agent in Glencoe, says she made it a practice this year to check in with all her sellers every two weeks to let them know it was time to bring down the asking price. “And most [sellers] got it,” says Matlin. “They’d say, ‘Gloria, let’s keep reducing it until it sells.’ But I fired three clients who wouldn’t let the price come down.”
Incentives, too, helped move a lot of properties this year, whether it was a free plasma-screen TV, cash back from the seller at closing, or a parking space at no charge. Ira Becker, a Jameson Realty Group agent, estimates that half the sellers he knows tossed in incentives this year. Builders of new homes especially prefer using incentives over price cuts, because they don’t then have to contend with earlier buyers fretting that the older, higher prices they paid are being undercut.
After all, who wants the value of his home to go down? Backpedaling to keep that from happening, some sellers pulled their homes off the market. Gloria Matlin says a number of big-ticket homebuilders on the North Shore have put their finished homes into the rental pool, in the hope that they can “stop the bleeding” and sell in better market conditions a year or two from now. These moves, as well as incentives and other tactics, contribute to what Joseph Pagliari, an economist at the University of Chicago’s Graduate School of Business, calls the “stickiness” of downward-moving real-estate prices. “In an environment of falling home prices,” he explains, individual efforts to keep from accepting a lower price add up to a collective foot on the brake.
All of this suggests that if your neighbors with their house for sale have been stubbornly holding to their asking price for months now, you might want to take them some cookies. At least they are doing their part to keep prices in your neighborhood from slipping any further.
THE DATA
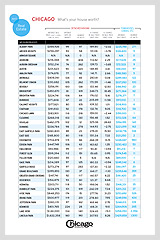
Click the thumbnail to view the PDF file |
These charts were prepared using data supplied by the Multiple Listing Service of Northern Illinois (MLSNI), which annually lists about 90 percent of the houses and condominiums put up for sale in the Chicago area. In addition to charting home prices in the 77 Chicago community areas recognized by the U.S. Census Bureau, we have also tracked sales in most towns in Cook, DuPage, and Lake counties where figures were available. For the outlying counties—Kane, McHenry, and Will—we have listed a number of representative towns. There are two anomalies: In Cook County, the town listed as Barrington on the chart also includes Barrington Hills, Deer Park, Lake Barrington, North Barrington, South Barrington, and Tower Lakes. In Lake County, the town listed as Round Lake also includes Round Lake Beach, Round Lake Heights, and Round Lake Park.
The first column of figures on each chart lists the average sale price for all the houses sold in each neighborhood or suburb from July 1, 2006, to June 30, 2007. (Obviously, if only a handful of houses were sold in a particular community, the average sale price risks being unrepresentative.) Average sale prices for the Chicago suburbs are based upon the sale of single-family homes, what the MLSNI classifies as “detached” housing. For Chicago, where a sizable portion of the housing stock is composed of townhouses, condos, and lofts—”attached” housing—we have also included average sale prices and number of sales for attached homes during the same period.
The second column reports the average number of days that houses remained on the market before they were sold, which can be an indicator of an area’s desirability. The third column lists the number of house sales within each community from July 1, 2006, to June 30, 2007.
The fourth column reports the percentage of increase or decrease in average sale price since the 12-month period beginning July 1, 1993, and ending June 30, 1994, the earliest date for which the MLSNI has comprehensive data available for most of the city neighborhoods and suburbs.
In Albany Park, for example, the average sale price 13 years ago was $134,203; this past year, it was $388,926, an increase of 189.80 percent.
The fifth column represents the percentage of increase or decrease in average sale price since the 12-month period beginning July 1, 2005, and ending June 30, 2006. In Chicago, we list the percentages for detached homes only. The percentages of change in sale prices since June 30, 2006, for townhouses and condos in neighborhoods with sales of 100 or more attached homes are:
| Albany Park |
3.13
|
| Avondale |
–1.62
|
| Belmont Cragin |
0.04
|
| Douglas |
–1.41
|
| Dunning |
–7.65
|
| East Garfield Park |
8.12
|
| Edgewater |
4.58
|
| Grand Boulevard |
0.70
|
| Hyde Park |
10.52
|
| Irving Park |
4.41
|
| Jefferson Park |
–3.54
|
| Kenwood |
5.22
|
| Lake View |
4.96
|
| Lincoln Park |
1.19
|
| Lincoln Square |
1.95
|
| Logan Square |
1.36
|
| Loop |
–8.44
|
| Near North Side |
10.73
|
| Near South Side |
4.48
|
| Near West Side |
3.55
|
| North Center |
5.13
|
| O’Hare |
0.93
|
| Portage Park |
–12.14
|
| Rogers Park |
7.40
|
| South Shore |
5.16
|
| Uptown |
2.83
|
| Washington Park |
7.87
|
| West Ridge |
1.32
|
| West Town |
–0.78
|
| Woodlawn |
1.41
|
In some instances, where data was insufficient or unavailable, we have inserted the symbol “N/A” (not available, or not applicable). Specifically, for city neighborhoods and suburbs—such as Fuller Park and Bannockburn— that had fewer than ten house sales during the 2006-2007 time period, we have listed no percentage change since 1994 or 2006 because the available data provided an insufficient basis for comparison between past and present sales.
About the Multiple Listing Service of Northern Illinois
Established in 1989, the Multiple Listing Service of Northern Illinois is one of the largest multiple listing services in the world, with more than 90,000 active real-estate listings, two million off-market listings, nearly 500,000 photo files, and four million tax records for eight northern Illinois counties (the six counties in our article plus Grundy and Kendall counties). Owned by ten local real-estate associations and made up of 50,000 subscribers in the real-estate industry, MLSNI and its computerized database help real-estate agents and brokers better serve their clients, whether they are buying
or selling a home.