 |
Tax-hating Chicagoans might consider making a happy home way up in Anchorage, Alaska, but should avoid being seduced by pricey Bridgeport, Connecticut. State and local taxes here are high, but other places’ are higher.
In a 2006 study published by the District of Columbia, a Chicago family of three making $75,000 a year were estimated to pay 9.9 percent of their annual income in state and local taxes, 17th highest of the 51 cities in the study. Equivalent families in Anchorage and Bridgeport would be taxed at 3.8 percent and 20.4 percent, respectively.
Of the $15,313 paid by the Bridgeport family, 68.2 percent goes to property tax, income tax takes 16.4 percent, and sales and auto taxes take around 8 and 7 percent, respectively. In Chicago, the bulk still goes to property tax, at 43.1 percent, while half of the $7,453 total bill is divided roughly equally between income tax and sales tax. In Anchorage, where there is no income tax or sales tax, property tax accounts for a whopping 93.7 percent of the measly $2,817 bill.
Nathan Anderson, an economics professor at the University of Illinois at Chicago who specializes in public finance and urban economics, offers a few caveats on these statistics. First, he says, the study’s findings inevitably involve guesswork and imputations. More important, average tax burdens do not explain what services cities provide in return for tax dollars or how much it costs to provide them. “Tax burden only tells you half of the story,” Anderson says.
To complicate matters further, some cities export taxes to nonresidents and maintain better services. For example, tourists and suburban shoppers along Michigan Avenue pay sales taxes. Similarly, in cities and states with significant industrial or business communities, individuals may pay taxes at lower rates. The money always comes from somewhere, though. “People pay taxes. You can levy a tax on corporations or on a business, but ultimately that tax has to come out of someone’s paycheck,” Anderson says.
How We Compare
Each year, the District of Columbia publishes a study of state and local taxes that compares the estimated tax burden at five annual-income levels in the largest city in each of the 50 states, plus Washington, D.C. The estimated tax burden includes state and/or city income tax, property tax, sales tax, and automobile tax. The graphs below show the estimated 2006 state and local tax burden as a percentage of total income for a hypothetical family of three at five annual-income levels in six U.S. cities.
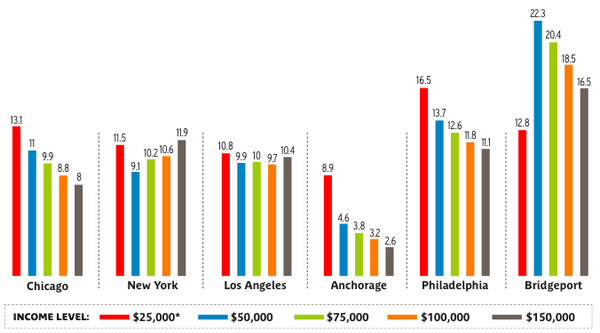
*This income group is assumed to comprise renters, and property tax is calculated as 20 percent of estimated annual rent.
Source: “Tax Rates and Tax Burdens in the District of Columbia—a Nationwide Comparison 2006,” issued November 2007, Office of the Chief Financial Officer of the District of Columbia
Best Sellers
Of the 51 cities included in the 2006 D.C. study, only one had a sales tax rate higher than Chicago’s. But the quarter-point increase April 1st and the 1 percent hike (voted March 1st) coming this fall will take Chicago to the top. Listed below are the six highest and five lowest 2006 sales tax rates from the study, compared with Chicago as of fall 2008.
Highest, 2008:
1. Chicago, IL 10.25
Highest, 2006:
1. Memphis, TN 9.25
2. Chicago, IL 9
New Orleans, LA 9
4. Seattle, WA 8.9
5. New York, NY 8.375
Oklahoma City, OK 8.375
Lowest, 2006:
47. Anchorage, AK 0
Billings, MT 0
Manchester, NH 0
Portland, OR 0
Wilmington, DE 0
Photograph: Jesus Jauregui/Istockphoto.com