When it comes to campaign finance laws, Illinois amounts to the Wild West. There are no state rules about who can contribute or how much they can give. It’s no wonder that Illinois has such a bad reputation for pay-to-play politics. So far, as of June 30th-the end of the last filing period before this issue went to press-Illinois candidates had raised about $95 million in this election cycle. But where does all the money come from?
Top 10 Contributors
By ZIP Code, to Gubernatorial Candidates
 For Rod Blagojevich 60601(Chicago) $1,318,097
|
 For Judy Baar Topinka
60611 (Chicago) $228,855 |
||
| 62704 (Springfield) 60606 (Chicago) 60602 (Chicago) 60625 (Chicago) 61702 (Bloomington) 62701 (Springfield) 60611 (Chicago) 60603 (Chicago) 60614 (Chicago) |
$509,579 $456,156 $317,156 $316,150 $308,000 $295,702 $293,977 $289,116 $224,550 |
62704 (Springfield) 62701 (Springfield) 60604 (Chicago) 60525 (Indian Head Park) 60090 (Wheeling) 62794 (Springfield) 60093 (Northfield) 60618 (Chicago) 60601 (Chicago) |
$184,725 $182,570 $162,000 $160,978 $127,500 $113,800 $94,845 $90,563 $89,610 |
|
Totals as of June 30, 2006. Source: The Institute on Money in State Politics
|
|||
|
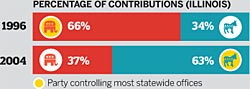
In politics, the spoils go to the winners.
When Republicans controlled the governor’s office, the state senate, and most of the statewide constitutional offices during the 1996 election cycle, the party handily outraised the Democrats. But during the 2004 elections, when the governor and all statewide officers but one were Democrats, the reverse was true. |
| Top 10 Political Contributors to Illinois Candidates by Category |
|
| 1. Candidate Self-Financed 2. General Trade Unions 3. Public Sector Unions 4. Candidate Committees 5. Lawyers and Lobbyists 6. Commercial Banks 7. Health Professionals 8. Party Committees 9. Telecommunications 10. Securities and Investment |
$9,806,721 |
|
Source: The Institute on Money in State Politics, 2006
|
|
|
How We Compare The Chicago metro area is the third largest political contributor in the United States, based on combined individual contributions to federal candidates, political parties, and PACS-well behind the top two metro areas, New York and Washington, D.C., but ahead of Los Angeles. And, when total contributions are broken down by ZIP code, Chicago has six ZIP codes ranked in the top 50. Source: Political Money Line |
New York |
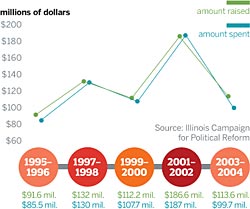
The Price of Politics Political contributions have been on the rise in Illinois, particularly in years with gubernatorial elections and other statewide office races. Source: Illinois Campaign for Political Reform |
For more information on political contributions and spending by candidates, try these sites:
Illinois Campaign for Political Reform www.ilcampaign.org
The Institute on Money in State Politics www.followthemoney.org
Federal Election Commission www.fec.gov
Illinois State Board of Elections www.elections.il.gov
Center for Responsive Politics www.opensecrets.org
photography: AP Photo/M. Spencer Green