
Ever since I heard tell of it, I've been eagerly awaiting a study by three members of the Federal Reserve Bank of Chicago: "The Effects of the 1930s HOLC 'Redlining' Maps."
It might sound like an arcane subject, but it's gotten a surprising amount of attention in the popular press over the last few years (driven in large part by the attention of The Atlantic's Ta-Nehisi Coates), and something I've turned my attention to a few times. In short, in the 1930s, the Home Owners' Loan Corporation attempted to figure out the creditworthiness of properties within wide swaths of American cities. Given the period, its metrics for creditworthiness were heavily based on the racial composition of neighborhoods—white flight meant that the presence of non-whites, particularly African Americans, brought the specter of housing-value collapse—and for a lot of reasons, these calculations were grounded in the work of Chicago economists and real estate professionals.
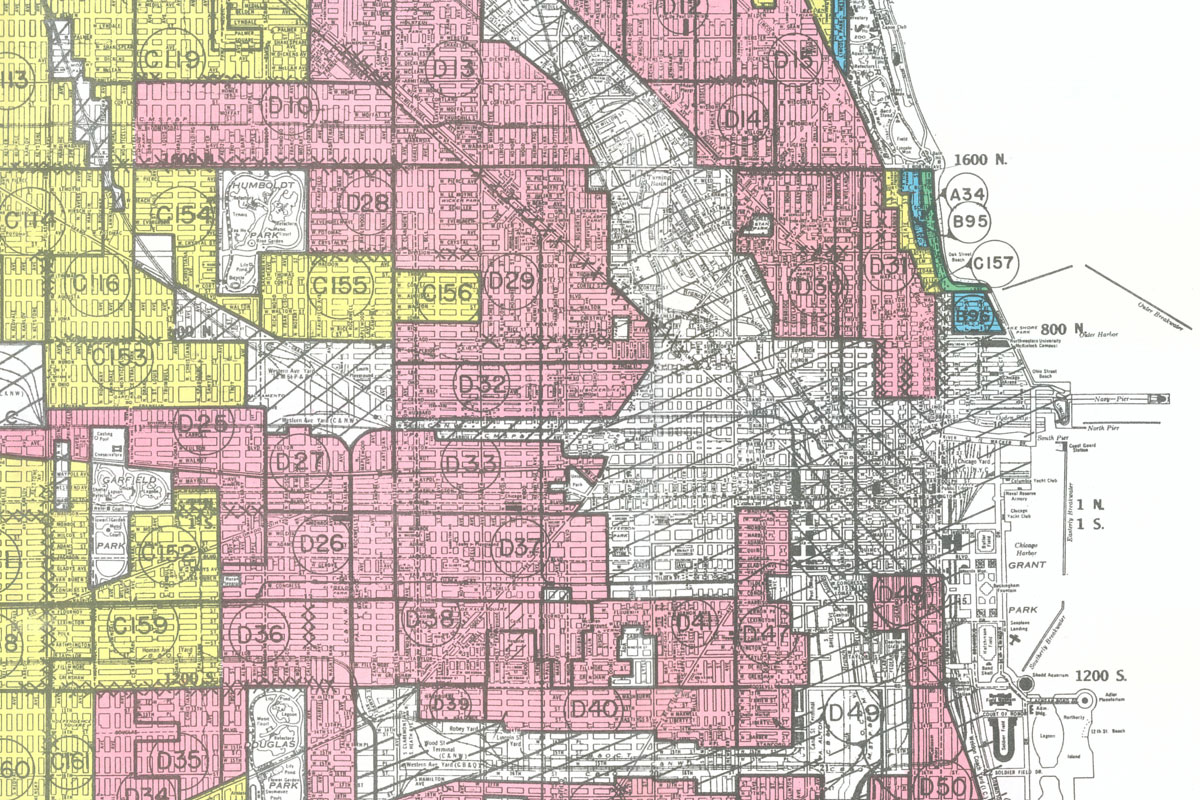
Not long ago, a team of academics digitized many of these maps. I spoke to one of the researchers involved, Virginia Tech's LaDale Winling, who called them the "Rosetta stone" of American cities. It's shocking how much of major cities were given D grades, the lowest possible credit-risk score, and outlined in red (hence, it's believed, the origin of the term "redlining").
Basically, the federal government determined that much of the nation's great cities were poor investments. But there's some debate about what that meant. Did it influence private lending? Was redlining a symptom of racial fears that drove segregation, or did it play a role in driving segregation? (It's obviously not just an either-or question.)
The significance of this study, which was recently released as a working paper by the Chicago Fed, attempts to answer this question. The authors—Daniel Aaronson, Daniel Hartley, and Bhashkar Mazumder—use the data created by the big HOLC digital-mapping project in order to test it.
To do so, they used potential weaknesses in the HOLC maps. The big swaths of grading clustered small areas of higher grades, like yellow C grades (more creditworthy), within large red D grade areas. "The idea is that there may have been difficulties in constructing polygons that fully reflected homogeneous neighborhoods—especially if there were small areas within larger neighborhoods that had fundamentally different characteristics. A prototypical example is a small island of, say, C-type streets within a larger ocean of D," the authors write.
Having found those islands, the authors then looked at the difference in percentages of African-American residents between D and C areas before and after the creation of the HOLC maps.
The idea can be a little tricky at first, but it's fundamentally pretty simple. Take two areas, which we'll name 1 and 2, which are geographically close to each other and similar in racial composition. Area 1 gets redlined (put into a D-grade area). Area 2 could have been redlined, but ended up in a yellow C-grade area because there were inevitably shortcuts in making the maps. If the HOLC maps increased segregation, the redlined Area 1 should become more segregated than yellow-lined neighborhoods, and Area 2, which could have been redlined but wasn't, becomes less segregated than Area 1—more like the C-grade areas it becomes part of.
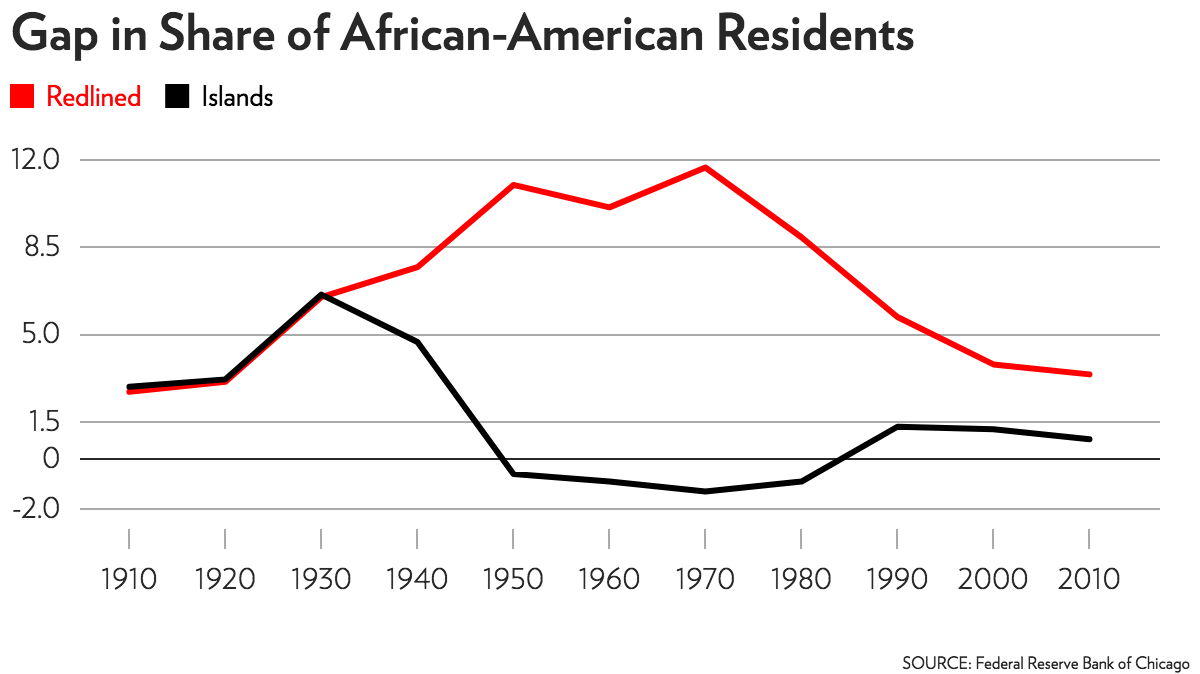
And that's exactly what they find. In 1930, just before the maps were published, the difference in the share of African-American residents between C- and D-grade areas—the "gap"—was 6.6 percentage points. The difference between the C-grade "islands" and their surrounding D areas was 6.5 percentage points.
After the maps are published, the numbers change rapidly. The difference between the C and D areas in 1940 is 7.7 percentage points, 11 points in 1950, 10.1 points in 1960, 11.7 points in 1970—with D areas gaining more black residents.
The difference in African-American population between the islands and D areas, though, decreases: 4.7 percentage points in 1940, and near zero in the subsequent decades. Though the "islands" originally had the characteristics of C-grade areas, after being labeled as D areas, they gained more black population than the C areas, suggesting that the redlining had a considerable effect.
But there's more. The authors also find effects between higher grades: "We find a strikingly similar pattern in 'C' neighborhoods that bordered 'B' neighborhoods, even though there were virtually no black residents in either neighborhood type prior to the maps," the authors write. The implication is that, by creating a C grade of relatively high credit risk and low appeal to lenders, that pushed African-Americans into C-grade areas as well (even though the C grade was applied to areas without substantial African-American populations).
Furthermore, the authors find similar gaps in home ownership and credit scores along the same lines, effects that persist into the 21st century.
There is a small silver lining, though. Take a look at the chart above—the gap reaches its highest point in 1970, and then begins to close. "One hypothesis is that policies enacted later in the 20th century, such as the Fair Housing Act of 1968 and the Community Reinvestment Act of 1977, designed to address discriminatory housing practices may have successfully targeted D but not C rated areas," the authors write. Basically, it's possible that housing policy improved conditions in those areas most affected by the HOLC maps and the greater socioeconomic conditions underlying those maps.
It's a working paper, so questions about what mechanisms underlie these changes remain. But it's a provocative suggestion that the HOLC maps really did matter, and that government policy helped create, rather than merely reflect, the economic and racial segregation of American cities. On the other hand, it's also a suggestion that government policy can address that legacy as well.