
The result in Illinois was never in doubt. The polling predicted a Clinton victory of 13-15 percent, and Clinton won by 16 percent. In the midst of a shocking election, it was a moment of literal predictability.
But there are some interesting results around the edges. Perhaps the most interesting is this: Clinton got a smaller percentage of the vote than Obama, 55.4 percent versus 57.3 percent. Trump fell to 39.4 percent from Romney's 41.1. The third-party share jumped from 1.7 percent to 5.2 percent.
It was a bad election for both major parties in Illinois. It looks particularly bad for Clinton, who won fewer counties than Obama did in 2012, and failed to capitalize on Trump's weakness as a candidate. One way of looking at it: Trump did worse than Romney, by percentage of the vote, in thirteen counties, but Clinton did better than Obama in only six.
Here's how that looks. Blue is where Clinton got a higher percentage of the vote than Obama; red is where she didn't.
Clinton 2016 vs. Obama 2012
On the flip side, here's how Trump did across the state, by percentage. Blue is where he got a lower percentage of the vote than Romney; red is where he got a higher percentage.
Trump 2016 vs. Romney 2012
If there's a silver lining for the Democrats, it's that Clinton made gains over Obama (again, 2012) outside the blue core of Chicago, and even outside the Chicagoland area. Clinton improved her percentage of the vote in Cook (0.4 points), DuPage (4.2 points), Lake (3.9 points), McLean (2.1 points), Champaign (3.7 points), and Kane Counties (1.8 points). Five of those six—excluding Cook—were the counties that Trump's percentage fell the most compared to Romney, from 6.3 percentage points in Kane County to 8.9 points in DuPage. Looked at that way, Clinton had her strongest performance not in Cook, but in the collar counties and two central Illinois counties. She didn't win McLean County, but her narrow margin of 1.4 percentage points is a considerable improvement over Obama, who lost it 54.5 percent to 43.4 percent.
Looking at them in comparison to Trump's best counties provides a useful comparison. Trump improved on Romney most in Henderson County (18.7 percentage points), Hancock (14.6 points), Gallatin (14.1 points), Scott (14 points), and Randolph (13.6 points). Those were also among Clinton's worst counties, where her percentage of the vote fell 15 to 22 percentage points. Those are huge swings, even considering those counties' relatively small populations.
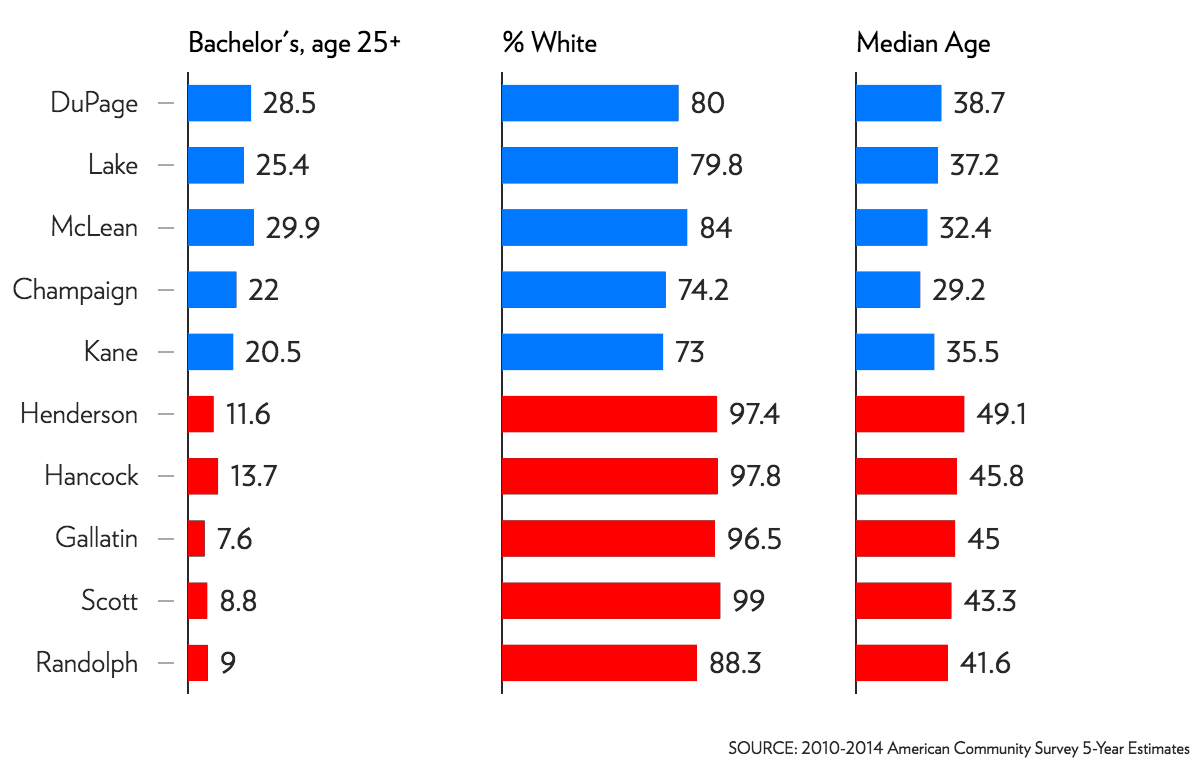
The candidates' best and worst counties share some defining characteristics. Clinton's strongest areas are comparatively young and diverse, with high percentages of the population age 25 or more with at least a bachelor's degree. Trump's strongest areas tend to be the opposite (Henderson County's median age of 49.1 is the highest in Illinois; DuPage, Lake, McLean, Champaign, and Kane are all within the 20 youngest counties in the state.)
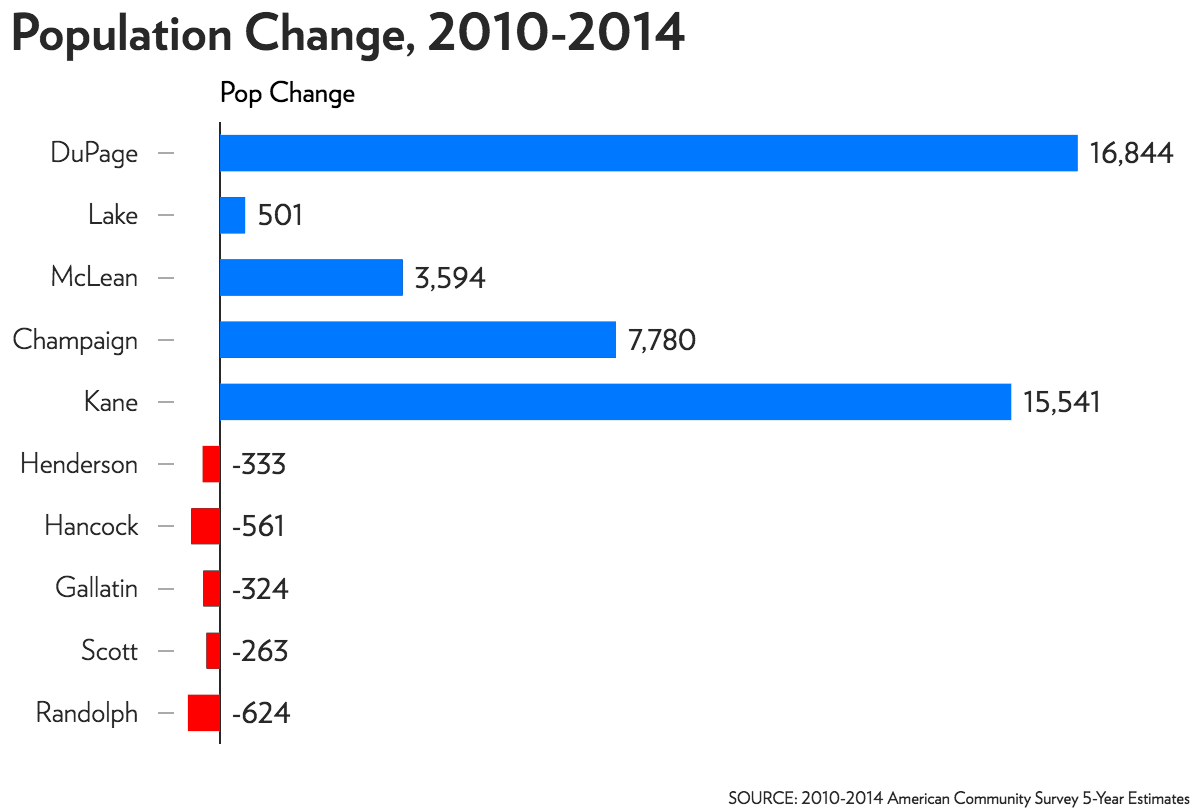
There's another big difference as well.
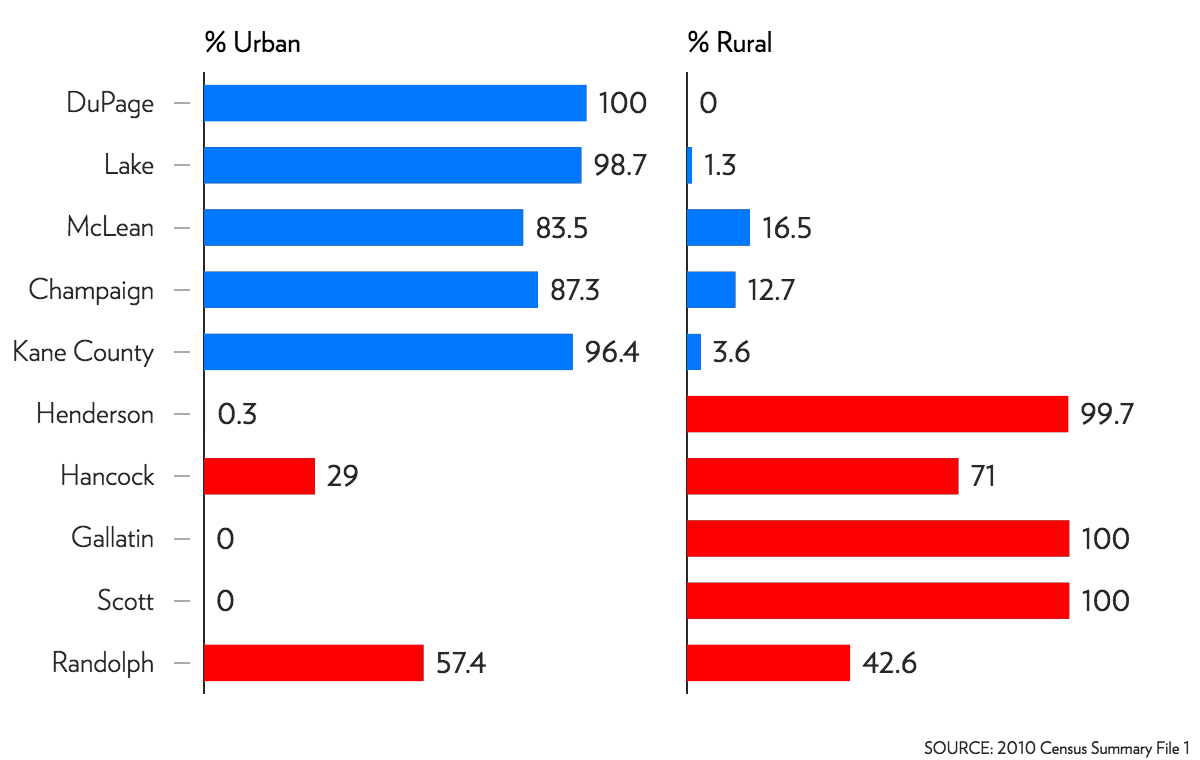
The results in Illinois, though barely newsworthy in a national sense, mirrored the national trends: she consolidated gains in urban areas and lost rural, largely white counties—many of which Obama won in 2012—in droves. But as Emily Badger, Quoctrung Bui, and Adam Pearce write in the New York Times, what's left in between this dramatic urban-rural divide is a contested middle ground of inner- and middle-ring suburbs. Clinton, despite being a seemingly weaker candidate, made considerable gains in those in Illinois. And not just in the Chicagoland area, but in growing demi-urban centers downstate with comparatively young and well-educated populations.
Brookings found that, nationwide, Clinton actually had a lower percentage of the vote compared to Obama in every type of area on the urban-rural divide except high-density suburbs (with an urbanization rate of 99.5 percent or more). She lost points in large metros (-0.5 percent); primary cities (-0.6 percent), mature suburbs (-0.2 percent), and emerging suburbs (-1.4 percent). And that largely mirrors her performance in Illinois.
The most urban county Clinton lost was Winnebago County (92 percent urban) where Rockford is located; it actually flipped, going 48-47 percent for Trump after going 52-46 for Obama. But it also has lower educational attainment (14 percent of those 25 and older have a bachelor's degree), and a relatively high unemployment rate (6.7 percent). Rock Island County, which is similar in economic and demographic terms, went for Clinton—but her percentage of the vote was just 51 percent after Obama won it with 60 percent of the vote in 2012. Both of those counties also lost population between 2010 and 2015: 8,186 in Winnebago, 1,413 in Rock Island.
Though all but completely ignored by Donald Trump and Hillary Clinton, the patterns in Illinois mirrored those of the nation at large. Clinton did well in urbanized, well-educated suburbs, continuing a trend in the Chicagoland area; Trump did well not just in rural areas but also in small and mid-sized cities, particularly in the Midwest. His campaign, as Andrew Small points out at CityLab, put together a robust network in those places—but he swung the vote in comparable places in Illinois without campaign infrastructure. It's a mirror that shows something more complex than an urban-rural divide.