
Chicago, in terms of both the city itself and its tech community, is collectively a pioneer in open data. Going back almost 20 years to Citizen ICAM, the city's long been on the forefront of collecting data about itself and offering it up to the public to parse.
The city's Data Portal is a great example—immense amounts of data freely available in useful forms. But it still has its limitations. Chicago's a city of neighborhoods, but the data about itself usually comes sliced by community area, ward, police beat, and so forth.
Much of it is geolocated, but pulling out that data to reflect the city as it's lived by its residents, instead of as divided by sociologists many decades ago, is time-consuming. For example, as my colleague Elly Fishman describes, Pocket Town is a distinct neighborhood carved out by infrastructure—but it's a tiny part of a big community area, and pulling data on it took me a couple days of cascading failures, aided by people who know a lot more about mapping than me.
Now there's a tool that makes slicing and dicing the city remarkably simple: Plenario. And, perhaps unsurprisingly given its legacy of neighborhoods, intense focus on geographical boundaries by decades of specialists, and its emerging open-data community, it was developed in Chicago. Specifically, it emerged from work done by Brett Goldstein when he was the city's chief information officer—and who, not coincidentally, is a former Chicago cop.
Goldstein told WBEZ's excellent Chicago Public Data tumblr that "one of the frustrations I expressed was that it’s great that we’re opening this data and it’s great we’re being transparent, but I feared that all we were doing at that point was putting spreadsheets on the web." Which isn't entirely true—the city's data portal has mapping functions, but they're not very robust. Plenario is much more robust. And it lowers the barrier to entry, requiring less time and fewer platforms to do more things with the data that Chicago (and other cities) are providing.
Here's how it works. Say you want data on certain types of crime for Ukrainian Village and only Ukrainian Village. First you set your timeframe; then you draw a map of the borders of Ukrainian Village, which are easy to find. Then you filter for CPD IUCR codes or incident types. Then you get a map and a timeline. Here's what I got from 13 years of crime reports for all forms of battery; this is just a screenshot, but all the data can be exported in machine-readable formats:
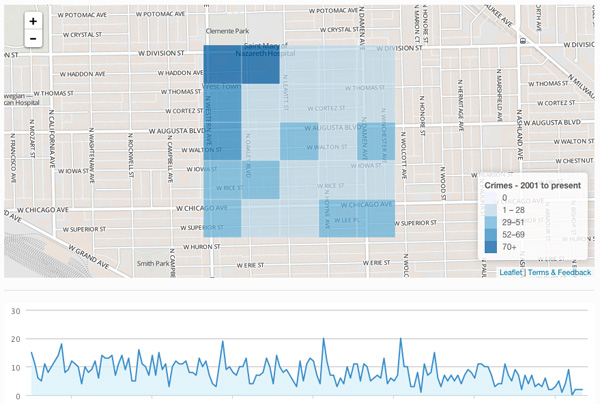
I'm just puttering, so don't read too much into it, but my first reaction is that the area around Clemente Park might return the most incidents because… it's a park. They're areas where people mix; when people mix, sometimes they get in fights.
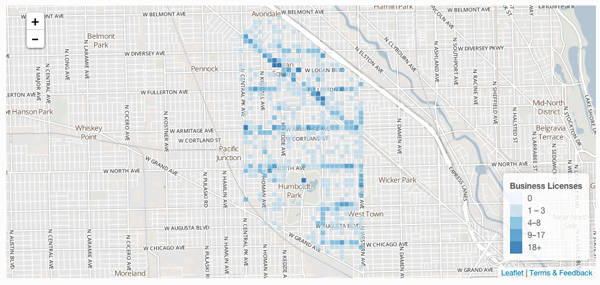
Or business license applications for an area including Logan Square and Humboldt Park, for this decade so far, unsurprisingly dense along the Milwaukee corridor near the square itself.
Plenario is still in alpha, and figuring out what to search for still requires some work, so, you know, there be dragons. But it's a promising tool to bring mapping down to earth.