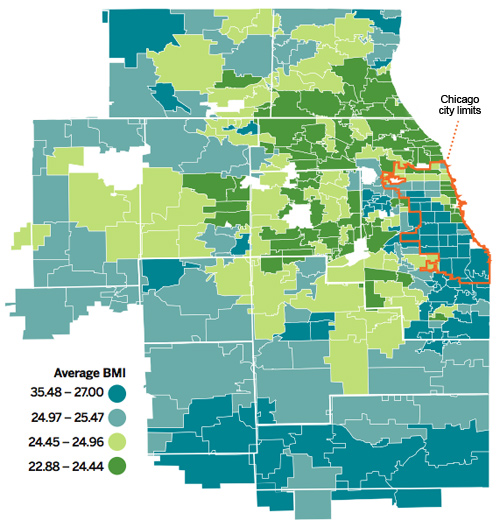
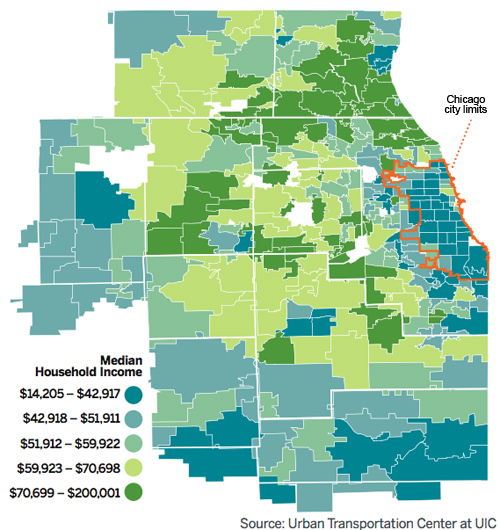
f you map obesity rates throughout Chicago, one thing becomes clear: The higher the average income in your ZIP Code, the thinner your neighbors are likely to be. Those are the findings of UIC's Urban Transportation Center, where researchers used heights and weights listed on seven million Chicago-area driver's licenses to determine an average body mass index, or BMI, for every local ZIP Code.
BODY MASS INDEX >> A BMI of 18.5 to 24.9 is normal for an adult age 18 and older; 25 to 29.9 is overweight; and 30 or above is obese. At 22.88, suburban Kenilworth, on the North Shore, has the lowest average BMI, while Hopkins Park, a southern suburb near the Indiana border, has the highest, at 27.19.
HOUSEHOLD INCOME >> The findings are no surprise to Steven Whitman, Ph.D, director of the Sinai Urban Health Institute on the West Side. "The two main risk factors for obesity have to do with eating and exercise, and both in turn are correlated with income," he says. In one institute study, Whitman says, "a woman told us, ‘I can step out my door and get an AK-47, but I have to ride three buses to get fresh fruits and vegetables.' "
|
ARE YOU CALLING ME FAT? >> CHICAGO AREA'S FIVE HIGHEST BMIs 1. 26.41 Bellwood 60104 2. 26.49 South Deering 60617 3. 26.51 Grand Boulevard 60653 4. 26.54 Chatham 60619 5. 26.55 Harvey 60426 >> CHICAGO AREA'S FIVE LOWEST BMIs 1. 22.88 Kenilworth 60043 2. 22.90 Glencoe 60022 3. 23.07 Winnetka 60093 4. 23.29 Wilmette 60091 5. 23.36 Lake Forest 60045 |
BY THE NUMBERS
|
16
Percentage of Chicago public high schoolers who are overweight |
75
Percentage of high schoolers who don't meet physical activity recommendations |
0
Number of written policies requiring physical education in Chicago public schools |
HOW WE COMPARE >> Percentage of state's population who are obese (BMI > 30)
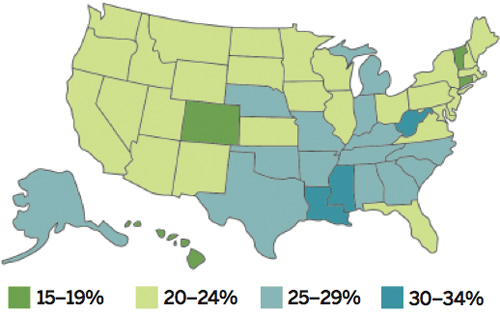
Source: Centers for Disease Control, 2005
GETTING BIGGER ALL THE TIME >> In most U.S. states, the percentage of adults who are obese has increased over a ten-year period. Here's how Illinois compares with its neighbors and the high and low ends of the BMI spectrum:
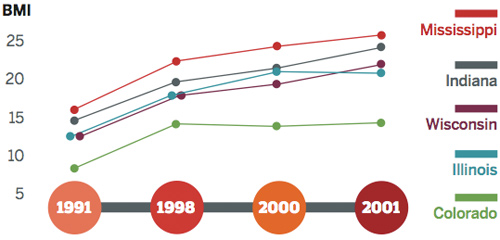
Source: American Obesity Association