Chris Sweda/Chicago Tribune
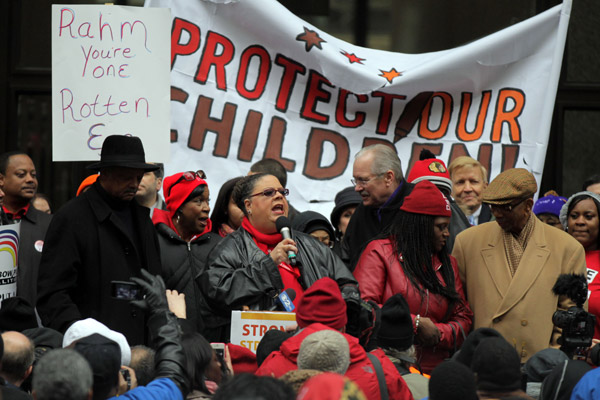
Chicago Teachers Union president Karen Lewis at Daley Plaza, March 27, 2013
The last time I looked at population change in the context of Chicago's school closings, someone mentioned that they'd like to see how many more or fewer kids lived in different Chicago neighborhoods. So I decided to run the numbers. Below is a map of population change at the census-tract level, for ages 5-14, from 2000-2010, combined with the non-charters targeted for closure.
Chicago lost a lot of kids in that time. The city's population decreased about seven percent from 2000-2010. Its 5- to 14-year-old population decreased about 22 percent, or over 94,000. The biggest losses of any age and gender groups were five- to nine-year-old boys (26 percent) and girls (25 percent).
The gradient runs from more than 75 percent loss to a greater than 100 percent gain; in some cases, the change does represent a small change in raw numbers, according to the Census data. (Census tracts represent about 4,000 people; 5-14 year olds represent about 15 percent of the population on average, so a typical census tract would have about 600 kids, though that varies with actual tracts.)
The K-8 population in most of Chicago has declined, with some exceptions—a swath from the South Loop through Lincoln Park and North Center, and around the city's edges in places like Clearing, Garfield Ridge, Dunning, and Norwood Park. It looks a lot like the general population change map, but with some exceptions, like Wicker Park and Bucktown, which have gained population but lost school-age population.
Related: Catalyst Chicago is on fire right now, with a look at what happened to students after the closing of four schools, a look at what's happened to closed schools, a look at the economic demographics of the attendance boundaries surrounding the closing schools, and more.