I feel bad devoting attention to Adam Dunn’s terrible season, the worst season in 20 years. I like Adam Dunn: I like that he’s basically a reincarnation of Dave Kingman; I like that he’s the exemplar of the Three True Outcomes; I like that he’s a throwback to the semi-ambivalent baseball player of the past. And I was excited to see him play in what everyone thought would be a good stadium for his talents. I don’t take any joy in his struggles.
But this has been a really boring year for baseball in Chicago. The Sox are literally slightly above average this year, and even though they’re only five games back of Detroit, it’s a weak division. The most compelling reason to pay attention to the Cubs is to watch their contracts expire. Dunn’s total collapse has just been… well, really interesting. He’s not the only huge disappointment on the team, but Alex Rios has had atrocious seasons before. Dunn’s just the most interesting story in local sports this summer.
You probably already know about the batting average and the strikeouts. You might know that he’s 3-for-81 against left-handed pitchers. Dunn has had the ninth-worst season in the past 50 years by wins over replacement player (-2.5, or Dunn has, if you believe the metric, cost the Sox two games over a typical "replacement"). But as Fangraphs’ Dave Cameron points out, Dunn is the only one of those players to have anything like a consistently good major-league track record. Cameron concludes: "Well, Adam Dunn might not be having the worst single season of the last 50 years, but he’s perhaps having the most inexplicably awful season over that time frame." It’s just interesting, sorry.
What you probably didn’t know, and I sure didn’t: Jeff Sullivan of Baseball Nation points out that Dunn not only is performing badly in almost every way you can measure…
Among 156 qualified hitters, Dunn’s average ranks 156th. His OBP ranks 142nd. His OPS ranks 155th. His strikeout rate ranks 156th.
… he also has the highest foul-ball rate in baseball (i.e. the percentage of balls he hits that land foul). By a fair amount. And the list represents, as my friend put it, a "ghost map of bad hitters."
What does it mean? No idea. As Sullivan puts it, "we don’t know much about foul-ball rate, and thus can’t be sure how to interpret this data, it seems clear that something has changed." Hopefully some sabermetric minds that are sharper than mine are on it.
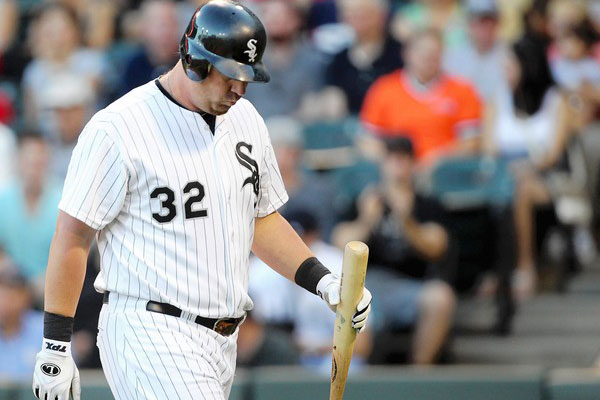
Photograph: Chicago Tribune