A couple times this year my wife and I have been wheedled into newspaper subscriptions by fundraising high-school students. After college a newspaper subscription was a non-trivial expense, and I consume most of my information online anyway, so it had been awhile since I got a daily paper. And the thing that surprised me the most about going back to the 20th century: how quickly you fill up a recycling bin. We're pretty good at recycling, so we usually manage to get all the recyclables sorted, and a daily paper still tended to consume most of our recycling output.
So I actually wasn't surprised by this (PDF):
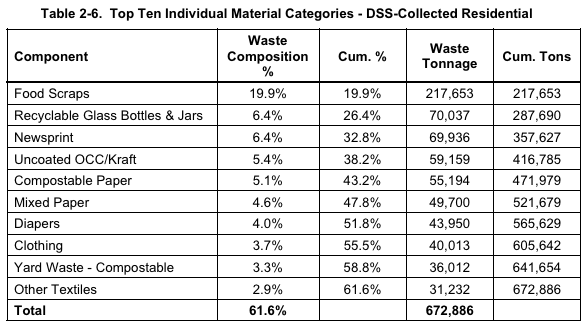
Print's not dead! It's just as popular as things that come in bottles and jars, if you judge it by waste tonnage.
Our trash is even broken down by income levels. (Well, very crudely, by ward income level. Look, people are studying your trash, so you can't be too choosy.)
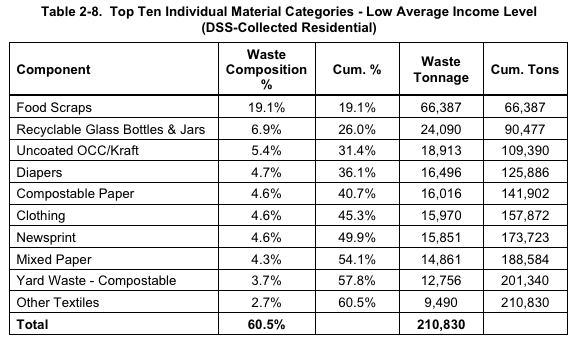
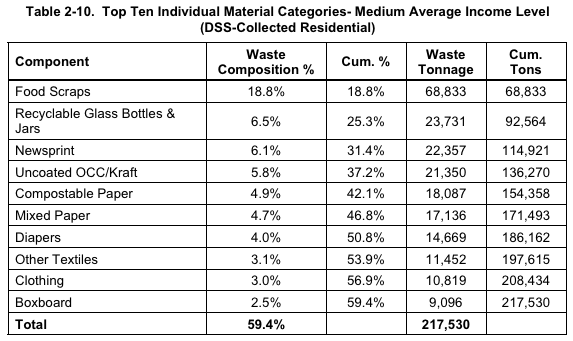
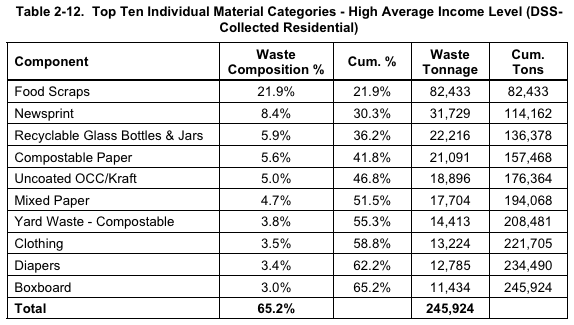
One thing that jumps out at me: the higher up the income level you go, newsprint becomes a higher percentage of your waste (as do magazines and catalogs, though not as dramatically). Which makes sense; subscribing to a newspaper isn't cheap. Diapers go in the opposite direction. Electronic equipment made up 0.3 percent of trash in low-income wards, within the margin of error; 0.6 percent in medium-income wards; 0.9 percent in high-income wards (3,326 tons).
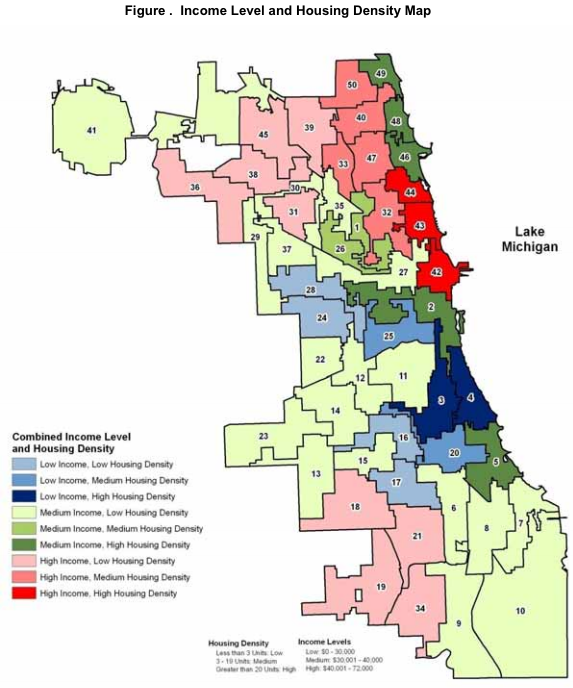
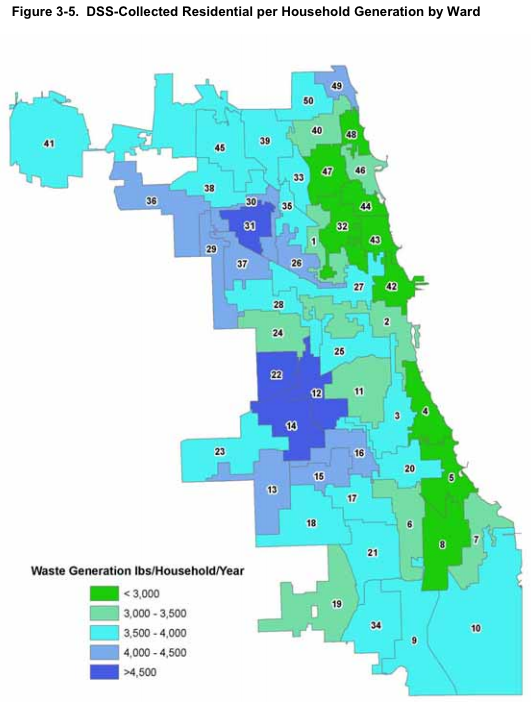
Who generates the most trash? Housing density and trash generation by household seem to correlate pretty well. High- and medium-income, low-density areas are more likely to generate more trash per household, whereas the high-density neighborhoods that run along the lake generate less trash per household, regardless of income:
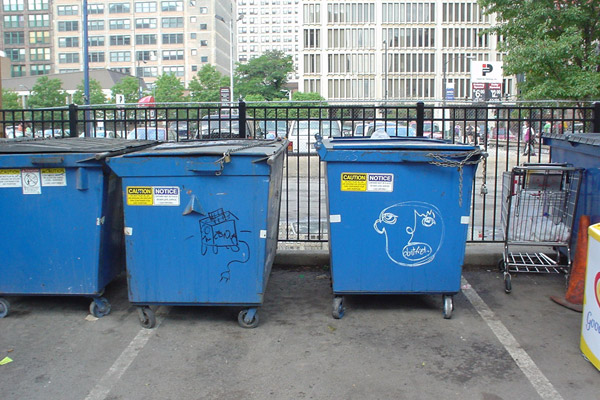
Photograph: Fuzzy Gerdes (CC by 2.0)