
The Cook County courts may have problems with data, but earlier this year Loyola's David Olsen produced an interesting report about the jail population in Cook County: what people are accused of, who goes to jail, where they come from (PDF).
* The number one offense? Possession of a controlled substance, not counting marijuana: 12,066 admissions, or 16.8 percent of the total (71,663 admissions in 2011).
* Comparatively speaking, not that many people go to jail for marijuana possession, but it's still a lot: 2,532 admissions, or 3.5 percent of the total.
* In terms of broad categories, the number one cause is violent crimes: 20,567 admissions, almost a third of the total.
* Of violent crimes, the most common is domestic battery: 9,108 admissions, or 12.7 percent of the total—along with drug possession, the only specific offense to account for more than ten percent of the total, and accounting for 44.3 percent of all violent-crime admissions.
* As you might guess, men are much more likely to go to jail than women, making up 86.5 percent of the 2011 jail population.
* How the genders break down in terms of crime:
males [are] more likely than females to be admitted for violent crimes (30.3% versus 23.5%, respectively) and traffic offenses (16.6% versus 12.2%, respectively). Roughly similar proportions of male and female jail admissions were for drug-law violations (27.9% and 24.8%, respectively). On the other hand, women were more likely than men to be admitted to the jail for property crimes (22.6% versus 17.7%, respectively) and sex offenses, which include prostitution, at 7.6% versus 1.5%, respectively.
* Women are slightly more likely to be older offenders: the average age is 32.5 for men, 33.8 for women.
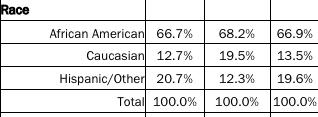
* Here's how it breaks down by race. The left column is men and the center column is women, and there are interesting racial differences between the genders; Hispanic/other men are more likely to go to jail than white men, while white women are more likely to go to jail than Hispanic/other women:
* Most people don't go back to jail twice in a year (83.2 percent), but men are a bit more likely to go back once or twice.
* 33 percent of admissions come from the south side, the highest percentage, just ahead of "outside of the city" (29.3 percent); the west side makes up 19.9 percent; the north side, 8.6 percent; the loop, 0.9 percent.
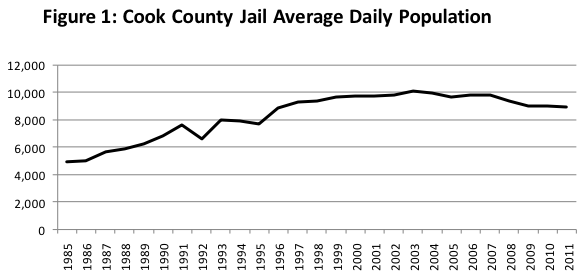
* People are spending more time in jail:
Overall, the average length of stay in the Cook County Jail has increased 13% over the past few years, climbing from an average (mean) of 47.9 days in 2007 to an average length of stay of 54.1 days in 2011, or 6.2 more days. Similarly, the median time spent in the jail increased from 11 to 12 days. While an increase in the average time served of 6.2 days per detainee does not seem like a dramatic change, when this small change is multiplied by the 73,369 inmates discharged in 2011, that additional 6.2 days translates to a total of 454,888 additional jail days (6.2 X 73,369), or an addition of 1,246 inmates to the jail’s average daily population (454,888 additional days of incarceration/365 days in a year). Looked at another way, if the length of stay in the Cook County Jail in 2011 was the same as it was in 2007, the average daily population of the Cook County Jail in 2011 would have been 7,650, or 28% lower than 2007, and would have been the lowest average daily population since the late 1980s.
Which is worth keeping in mind when you look at the jail's average population over time:
Since 2004, there have actually been substantial declines in case filings; there's been a drop in the jail population as well, but it's small compared to the drop in filings: "between 2007 and 2010 (the most recent publically available court data), felony filings in Cook County decreased 16% and misdemeanor case filings fell 25%… but the jail’s average daily population only decreased 7%."
Photograph: Chicago Tribune