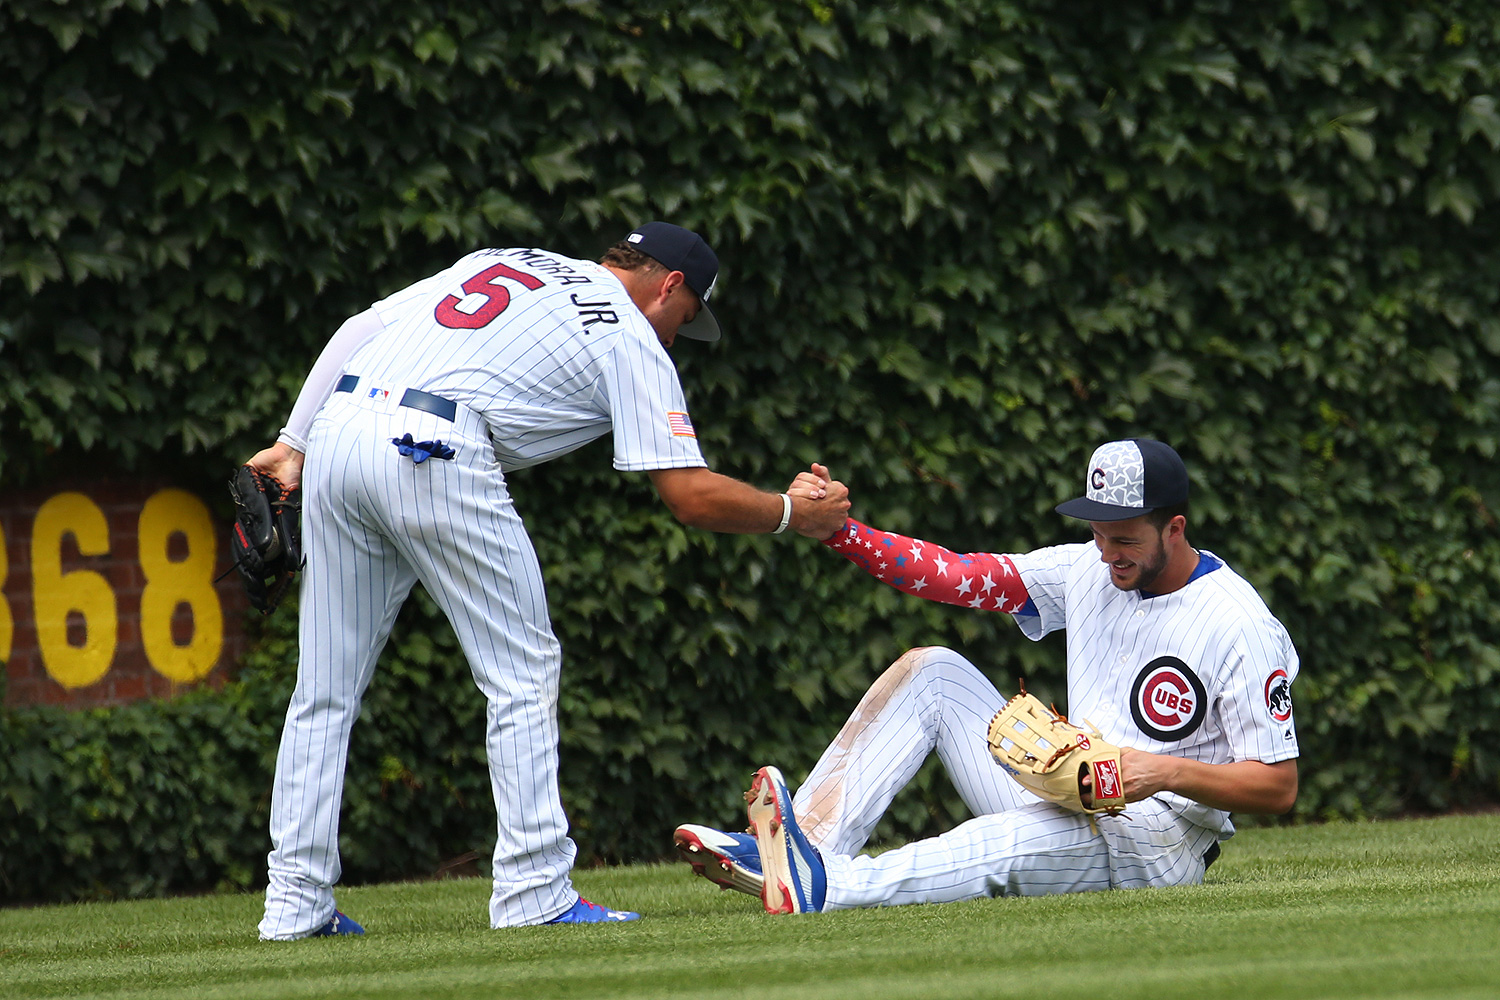
The Cubs fell out of first place—in the whole of the major leagues, at least. The Giants have a .621 winning percentage; the Cubs, .612; the Rangers, .609. It's a rough skid for a team that started impossibly hot, going 17-5 in April for a .773 winning percentage on the strength of a +79 run differential.
That slid to .643 in May, with a +49 run differential. Then .571 in June, at +41. July has been brutal, though: they're 1-6 with a -21 run differential. So I went back and looked at something which fascinated me the last time I checked on the Cubs—their pitchers were on pace to have the lowest number for batting average on balls in play since the 2001 Seattle Mariners, who still hold the major-league record of 116 wins in a season. From the beginning of the season through the end of June, the Cubs' BABIP hovered around .250. In July, it's been .306. (The Rangers are 2-5 in July with a .363 collective BABIP.) In prior months, they were giving up less than a home run per nine innings; in July, they've given up 2.76 per nine. It is, of course, a tiny sample size, but the Cubs' pitchers have collectively been the worst in baseball this month.
Another statistic suggests some unusually poor luck. In July, nearly a quarter of the fly balls hit against the Cubs have gone for home runs; the rest of the season, it's hovered around 10 percent. Which is how you get this:
| Month | ERA | FIP | xFIP |
|---|---|---|---|
| March/April | 2.44 | 3.00 | 3.50 |
| May | 2.91 | 3.74 | 4.11 |
| June | 3.12 | 3.76 | 3.93 |
| July | 6.97 | 6.63 | 4.84 |
ERA is, of course, how many earned runs the team gives up per nine innings. FIP calculates what a pitcher's ERA would be with "league average results on balls in play and league average timing," in an attempt to isolate a pitcher's performance from good or bad defense and luck. xFIP takes that one step further, by calculating what a pitcher's ERA would be with a league-average home run to fly ball ratio—something that jumps around but tends to normalize over time.
All the Cubs' July numbers are bad, but the ultimate result—giving up seven runs a game—is considerably worse than attempts to isolate the Cubs' actual performance on the mound. Conversely, their ERAs in prior months were lower than their FIP and xFIP, suggesting that the team was benefiting from some luck. It's good news/bad news: Their pitching staff probably isn't as bad as it's been in recent games, but not as good as it seemed in the first month or two.
More encouragingly for the Cubs, they still have an astonishing run differential—148 runs, 51 more than the second-place Nationals. (The Cardinals, who are a mere 44-41 and eight games back of the Cubs, are actually in third at 79 runs.) Baseball Prospectus gives them first-, second-, and third-order winning percentages—different ways of calculating how much a team "should have" won—of .680, .714, and .696.
Most importantly, despite their slump, they're eight games ahead of the Cardinals and 8.5 ahead of the Pirates. The playoffs are so difficult to predict and plan for that the point of the season is to get there, and the Cubs still have a long way to fall before that becomes a crisis. And the underlying numbers suggest that it won't.


