Trib reporters Antonio Olivo, William Mullen, and Dahleen Glanton have a good piece in today’s paper about how the collapse of the housing bubble has hit Englewood; it’s a good companion to the reports earlier this year about the 2010 census figures, which showed a substantial decline in the city’s black population. And if you haven’t read it, now’s a good time to go back and read the Tribune‘s 2005 piece on real-estate fraud on South May Street in Englewood and its companion, which underlines how long the collapse has gone on—and, it should be noted, was written while the real estate bubble had yet to burst:
Drug-dealing gangs, including Chicago’s Black Disciples, have adopted the financial crime, the Tribune found. Mortgage swindling helped that gang solidify its control over street corners, launder money and gain safe houses to launch operations.
And giant lending companies, including the market-leading CitiFinancial, a division of the global bank Citigroup, found themselves embroiled in massive fraud schemes.
In federal and state cases filed since 2000, the Tribune identified 524 Cook County homes used by swindlers. Those homes–which prosecutors say represent only a fraction of the frauds that actually took place here–were intensely clustered in low-income and minority communities, the paper found.
In the 41 Chicago census tracts hit hardest by mortgage fraud, 39 percent of the residents lived in poverty, nearly twice the citywide rate, and 96 percent were African-American.
The latest story includes a handy map showing both population decline and vacant housing, the latter taken from Woodstock Institute research. It’s not the first good story to rely on Woodstock’s data; Megan Cottrell of the Chicago Reporter recently published a long piece on the prevalence of Chapter 13 bankruptcy in the city, which has also hit the south and far west sides the hardest.
Another data set, if you want a different look at the housing crisis in Englewood, and the housing-price madness of the bubble, is home prices. I’ve been messing around on Redfin, which conveniently provides not just current prices but in some cases housing-price histories, and the numbers are, in many cases, shocking.
* Two flat, selling for $34,500. Sold in 2000 for $25,000. Sold in 2005 for $185,000. Sold in 2009 for $14,900.
* Three bedroom, selling for $39,900. Sold in 2006 for $54,500. Sold in 2009 for $100,000.
* Three bedroom, selling for $108,000. Between 2002 and 2009, it was sold six times, from $23,900 to $125,000 to $15,000.
* Three bedroom, selling for $29,900. Sold for $70,000 in 2008.
* Four bedroom, selling for $9,900, about the cost of a seven-year-old truck. Sold three times between 2001 and 2007: $67,000, $100,000, and $125,000.
* Three bedroom, just sold for $6,900. It was sold five times between 1999 ($20,500) and 2008 ($150,000).
* Two-flat, selling for $30,000. Sold three times between 2000 and 2008 for $125,000, $170,000, and $76,500.
* Five bedroom selling for $31,000. Sold five times between 2002 and 2009, going from $115,000 to $260,000 to $15,000.
What’s interesting to me about this is not only the immense collapse in prices, but also the amount of selling going on. Universal home-ownership, a goal of both the Clinton and Bush administrations, was pushed as a neighborhood- and family-stabilizing measure, but as the housing market lost control, the opposite became true.
It’s eerily reminiscent of the story Beryl Satter tells in Family Properties, which focused on Lawndale in the 1950s—redlining and contract sales allowed property owners to sell properties at inflated rates, then retain them when buyers couldn’t make payments, over and over again, destabilizing the neighborhood’s nascent middle class. It’s an extraordinary book, one of the best I’ve ever read about Chicago, and critical to understanding the history of the south and west sides in postwar Chicago (and a good companion to Making the Second Ghetto and Blueprint for Disaster).
As Steve Rhodes points out, many were surprised to the point of incredulity when the 2010 census results showed an exodus from neighborhoods on the south and west sides. Attention was immediately drawn to the Plan for Transformation and the destruction of Chicago’s public housing projects, but it’s worth considering the potential effect of the housing bubble, which encouraged selling followed by speculation, and drove the price of housing to unaffordable and unsustainable levels. Here’s a Zillow-generated chart for the median home list price in Englewood over the past decade:
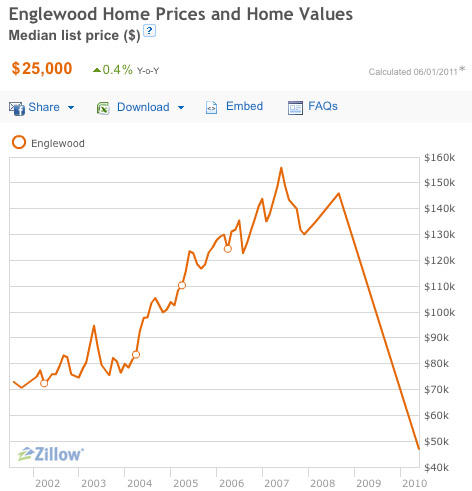
The massive decline is eye-grabbing, but just as important is the immense increase in home list prices in an area with a median household income of about $20,000—which, according to this mortgage calculator, suggests that an affordable house is closer to the $60,000 range.
Update: Matt Carmichael of Advertising Age has some good questions. One thing I did find is a Chicago Rehab Network study (PDF) which shows considerable overlap between the increase of housing prices from 2000-2006 and decrease in population from 2000-2010:
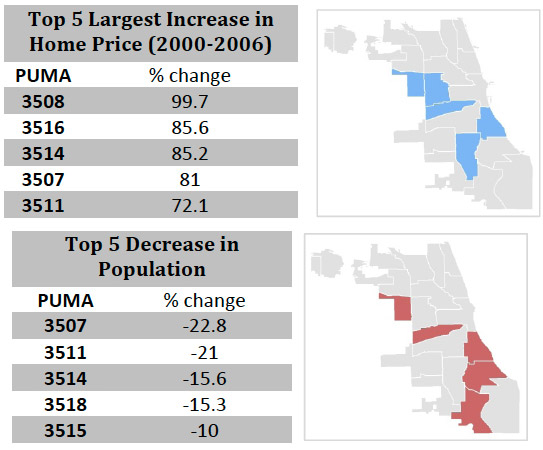
The study also notes that Englewood is among the Chicago neighborhoods with the highest "affordability gap"—"where housing prices and median income show the largest growth disparity." Of course, keep in mind that this is correlation, not necessarily causation. Carmichael points out that "nationwide, blacks have been flocking south more for jobs than housing." Speaking of which, here’s an interesting study (PDF) from the Brookings Institution from 2004—before the 2010 census kicked off a new round of reverse-migration stories—suggesting that the vanguard of the reverse migration was middle- and upper-middle-class, college-educated African Americans.