Awhile back, a study by the prominent sociologist Edward Glaeser claimed we were seeing the "end of the segregated century"; Glaeser emphasized the increasing diversity of Chicago, among other things. But as the Reader's Steve Bogira pointed out, Glaeser was subtly substituting "Chicago" for the Chicago metropolitan area, which stretches all the way from southeast Wisconsin to northwest Indiana. Glaeser did capture the increasing diversity of the Chicago MSA, but it was more a reflection of the increasing diversity of the suburbs than that of Chicago proper.
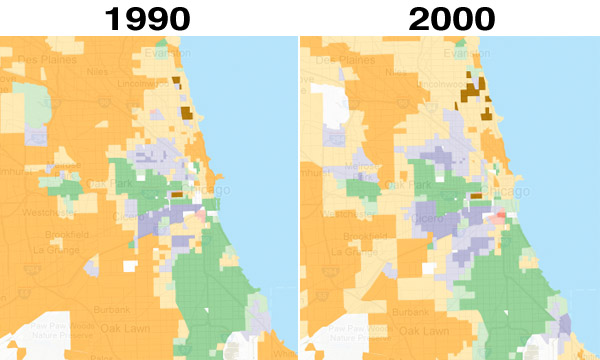
A site I was just introduced to (h/t Balloon Juice), MixedMetro.us, provides a nice interface for browsing the change in the composition of cities and states from 1990 to 2000, shown by census tract. White-majority census tracts are orange; black-majority are green; Latino-majority are purple; Asian-majority are red; and brown is "highly diverse," in which no race predominates. Darker colors are low-diversity; lighter colors represent moderate diversity.
The big story from 1990-2000 within the city was, obviously, the expansion of Latino-majority tracts, particularly on the northwest and southwest sides. Outside of the city, what was once a near-uniform low-diversity white swath ceded to still-white but moderate-diversity tracts.
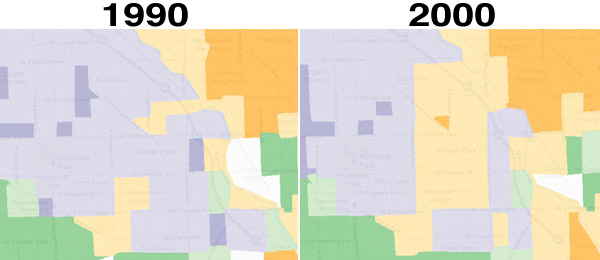
Focusing on Wicker Park, you can see the effects of gentrification; that little triangle of low-diversity white in 2000 is Milwaukee-Damen-North:
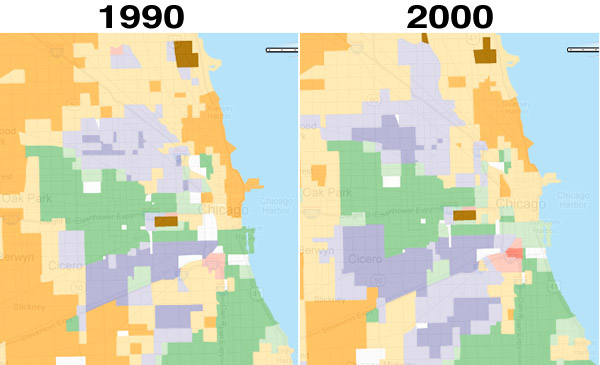
Here's a view of the center city. The gentrification of Wicker Park/Bucktown is even more dramatic from this angle, and you can see the beginning of the gentrification of the Near North Side just east of Goose Island, around Cabrini-Green.
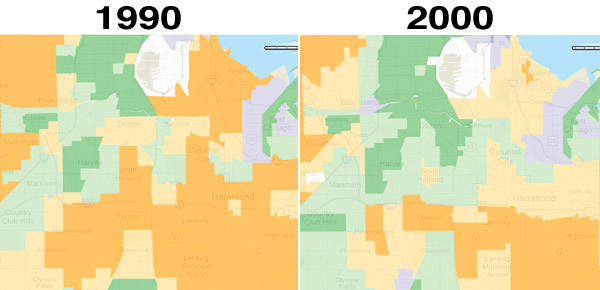
The far-south-side and south suburbs shifted to more low-diversity and moderate-diversity black-majority census tracts:
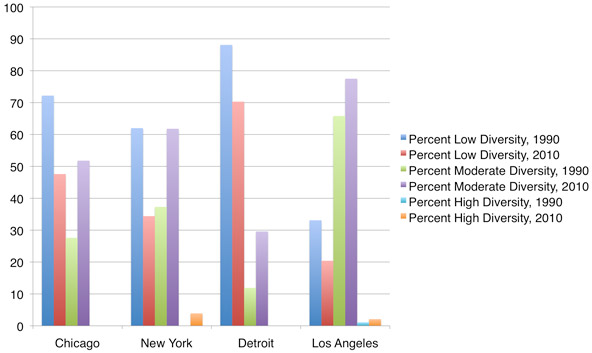
The site also gives "transition matricies" for 1990-2010, which allow you to compare cities by the number of low, moderate, and high-diversity census tracts. The results also reflect the increasing diversity of Chicagoland, but it still compares unfavorably to New York and Los Angeles. The low/moderate diversity ratio is almost 50-50 now, but the number of "high-diversity" tracts—not particularly high in New York or Los Angeles either—remains statistically negligible.