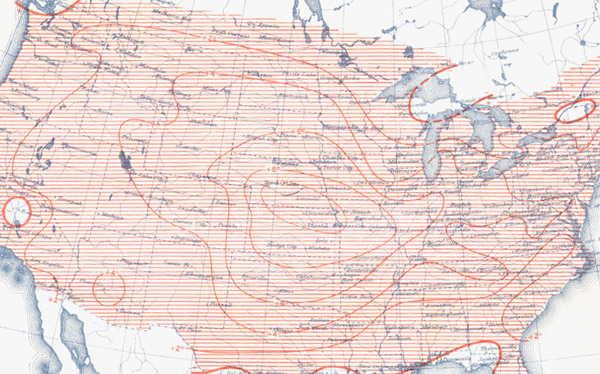
It's 2 PM and 102 degrees at Chicago Midway, and we seem to be closing in on the all-time record of 105 degrees (temperatures usually peak between 3 and 4 PM; never mind, it just dropped 19 degrees). The prior record was set on July 24, 1934—an ill time for such a record, in the middle of the Great Depression and the ongoing extreme drought of the Dust Bowl. It was only anomalous in being just slightly hotter than the rest of that summer. July 1934 was intensely hot across virtually the entire country, with above-normal mean temperatures covering the entire country that July:
The mid-1930s were a particularly calamitous time for weather, with a frequency of heatwaves much greater than that of the past few years, and it would only get worse (source: EPA).
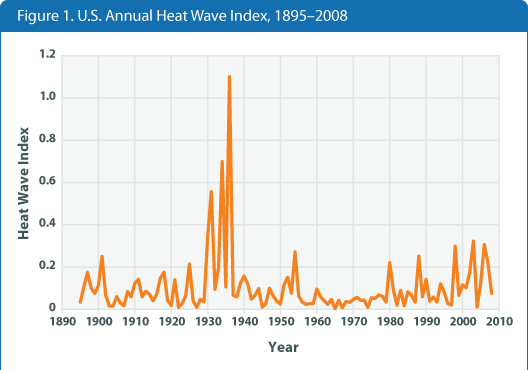
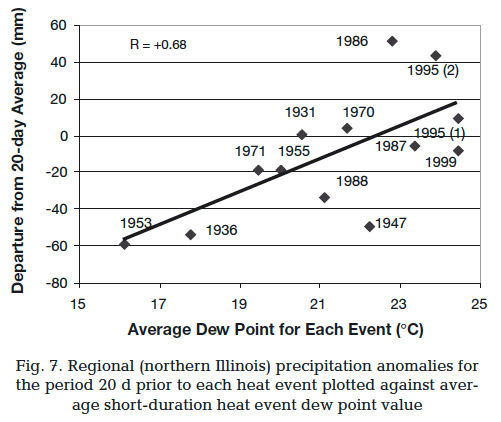
(The heat wave index reflects a "four-day period with an average temperature that would only be expected to occur once every 10 years, based on the historical record.")
1936 was the worst of it—in some ways, the most extreme weather year in U.S. history. In terms of "short-duration heat events," the highest average hourly temperature for a three- or four-day period in Chicago was July 12-15, 1995, at 91.2 degrees; in second was July 10-12 1936, at 90.1 degrees. (From 12:51 AM yesterday to 12:51 PM today, the average was 89.3 degrees.)
Detroit was devastated by the heat wave; 364 people died after seven straight days that hit 100 degrees:
Friday was the first time in history that three consecutive 100 degree days had been recorded in Detroit. It reached 101. As the weekend began, crowds began to throng to Belle Isle. It was a Detroit tradition to camp out on the island when oppressive heat moved in. But never in such numbers. Police reported that there was not a parking space to be found on the island and traffic was backed up from the bridge along East Grand Boulevard all the way to Kercheval. The island looked like a massive gypsy camp, with hundreds of thousands of families sleeping out in the open, wherever there was an open piece of grass.
1936 was the hottest summer in the U.S. on record, but the winter of 1936 was cold: the mean temperature in January in Chicago was 17.1 degrees, thirteen degrees colder than this January.
So the 1930s were, for summer heat, worse than the oughts. And that's reflected in the data:
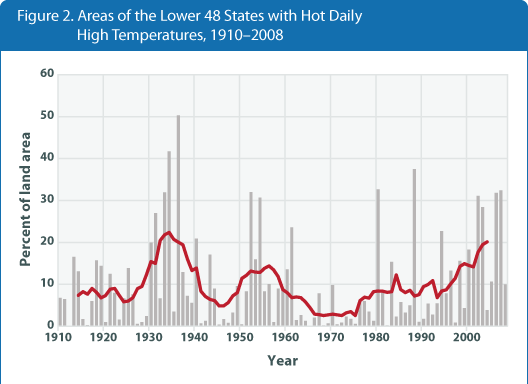
(This chart shows "the percentage of the land area of the lower 48 states with summer daily high temperatures well above normal.")
The line represents a smoothed nine-year moving average, which is reaching 1930s levels. What's more worrisome, though, is the high low temperatures:
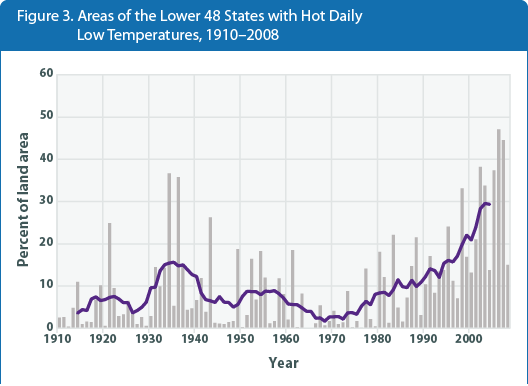
The graph is identical to the one above; otherwise it measures daily low temperatures that are above normal. Those have grown dramatically more frequent. And it was the high daily lows that played a major role in the severity of the 1995 heat wave:
The heat wave has been found to be remarkably unusual, but only partially because of the extreme high apparent temperatures (an index of the combined effect of temperature and humidity on humans), where the authors calculate a return period of the peak apparent temperature of ≤ 23 yr. Of greater significance were the very high temperatures that persisted day and night over an extended 48-h period. Analysis presented here indicates that for Chicago such an extended period of continuously high day and night apparent temperature is unprecedented in modern times. The 2-day period where the minimum apparent temperature failed to go below 31.5°C (89°F) is calculated to be an extremely rare event (probability of occurrence < 0.1%) based on a 10 000-yr-long simulation of a four-parameter (temperatures related to the mean, the intraseasonal daily variance, the interannual variance, and the day-to-day persistence of temperature) probabilistic model.
Humidity was also a factor. During the 1995 heat wave, the dew point got into the low eighties; the highest it's been during these past couple days of intense heat was 7.1 72.0 with humidity of 69 71 percent.
Speaking of dew points, in 2003 NIU professor David Changnon was the lead author on an interesting paper (PDF) that suggested higher dew points could be the result of changing agricultural practices. Dew points have been higher during recent heat waves:
Along with farming methods:
During the last 20 years cultivation practices have shifted. Many farmers in Illinois now practice no-till cultivation, leaving the post-harvest materials on the surface, which acts to reduce runoff. The water that previously went into runoff now has a greater chance of going into soil recharge and being available for the following growing season…. These results provide indirect evidence of increased sub-surface storage, which could allow enhanced growing-season evapotranspiration. Thus, regional increases in precipitation combined with changes in agricultural practices may have led to higher water vapor levels which may be related to observed increases in cloud cover.
Which, at the time, worried Changnon:
"Heat waves today are different than they were a half century ago because they are more frequently accompanied by extreme spikes in humidity," Changnon said. "I strongly suspect that changes in agricultural methods — particularly in the area of corn production — are playing a major role in this by adding more water vapor to the lower atmosphere of the Upper Midwest."
All plants transpire, that is, release water vapor into the atmosphere through their leaves. Corn is unique in that it belongs to a family of plants that transpire, or sweat, both day and night. "Stand in any cornfield and you can feel the increased humidity," Changnon said.