The Tribune‘s Diane Rado has a good piece today on underfunding in the Teachers’ Retirement System, the pension fund that covers non-Chicago public teachers in the state of Illinois. Here’s the lede:
The Teachers’ Retirement System, the largest and costliest of Illinois’ pension programs, is now almost $40 billion short of what’s needed to cover future benefits — the deepest financial hole in 20 years of state records.
Makes sense. But the further I follow the history of the TRS the more confused I get. From the reporting, it seems like it’s been in crisis since before I was born, which doesn’t make it seem like a crisis, and we’ve always been addressing it, which makes it seem like we haven’t. (I’ve bolded the funding ratio throughout.)
1973: Actually, let’s break these out.
One article (6/2/73) describes a bill meant to "fully fund the downstate teachers retirement system over a 50-year period" which would "begin paying off a $1.8 billion deficit built up since the teachers retirement system was established in the 1930s [ed. note: 1939]." Rep. James Washburn (R-Morris) claimed at the time the TRS "will run out of money by 1985 if we don’t start meeting our obligations."
A second (7/3/73) mentions the conclusion of of a lawsuit filed by the Illinois Education Association, in which "the Illinois Court of Claims ruled yesterday that the state is obligated to pay a $2.6 billion shortage in teacher pension funds caused by years of underfunding…. It contended the systems [the TRS plus the State Universities Retirement System] were being funded at about a 30 per cent level."
So it appears the $2.6 billion figure is higher than the $1.8 billion figure because of the SURS; the funding level encompasses both. It’s also worth noting this wasn’t the last 50-year plan; another one was instituted in 1995, according to an excellent series in the Daily Herald from 2010 (the timeline at the bottom is handy).
1976: An 8/11/76 article doesn’t break out the TRS from a half-dozen other funds, but the executive director of the Illinois State Employees Retirement System, Michael Mory, is quoted as saying "a good rule of thumb is that these kinds of pension programs should be currently funded to about two-thirds of their expected future payout needs. The Illinois programs are funded at only about 40 per cent."
1983: Oh, hey, this is handy:
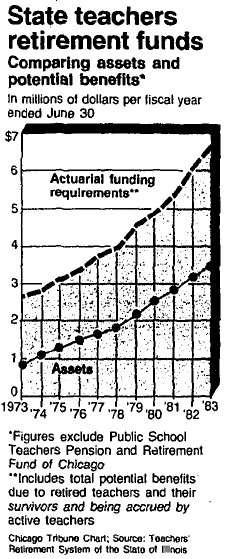
The exact figures for 1983, according to the article, are $3.4 billion in reserves, and liabilities for both retired and active teachers of $6.6 billion. So a little more than 50 percent, or less than the two-thirds rule of thumb that’s still widely accepted. As you can see from the chart, it’s obviously an improvement over the scenario ten years prior.
1983-1993: Info was a bit harder to come by, but I did find this, from an archived 1993 issue of Illinois Issues:
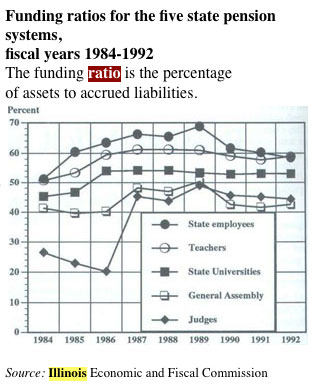
The teachers’ pension is the open-circle line, and appears to account only for the TRS, not SURS. As you can see, the assets-to-liabilities ratio improved to hover around 60 percent.
1993: "Of the five pension systems, the Teachers‘ Retirement System had the highest funding ratio at the end of fiscal 1992, at 58.9 percent, and the highest deficit, at $6.8 billion"
1997: The unfunded liability for retirement benefits under the state’s five pension systems increased more than $1.3 billion last budget year, Auditor General William Holland said Thursday. Holland’s audit for the budget year that ended June 30 found almost $1 billion of the increase was attributed to the Teachers‘ Retirement System. Holland said the liability for retirement benefits had been projected to exceed the pension systems’ assets this year. The $1.3 billion increase might have been even higher if not for a state law that requires increased state funding for the pension systems, with the money coming off the top before lawmakers can consider other funding issues.
2003: "Of the five funds, the one in the sorriest shape is the Illinois Teacher Retirement System, which provides the pensions for suburban and downstate teachers. Its ratio of assets to liabilities stood at a mere 52 percent last year, so poor that it was considered among the five worst-funded plans in the country."
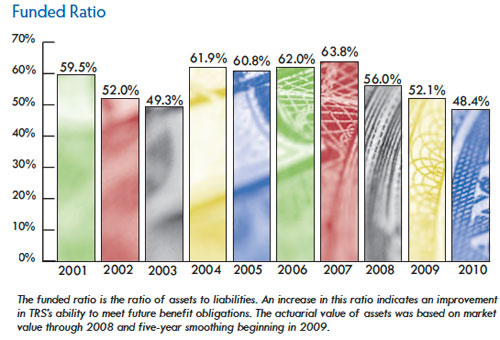
2001-2010: Here’s a handy chart from the TRS, which matches with the reported figures from the Tribune‘s coverage:
OK, so that brings us up to date. The point, I think, has been to demonstrate that pension math is really hard. Which doesn’t sound terribly profound, but it’s important: I’m pretty well-educated (if an English major) and follow politics closely. Yet pensions, arguably the biggest long-term problem for the city and the state, are still very opaque to me.
And I think it has a lot to do not just with the variables, but also the vocabulary laymen like me have to discuss pensions.
For instance: the TRS shortfall, as Rado describes, is enormous. The assets-to-liabilities ratio is very bad: well below what’s considered actuarially sound, and it’s as low as it’s been since the 1970s. But it’s not that much worse than 2003. But then again the market went on an irresponsible joyride between 9/11 and the collapse of the housing bubble, one which was worse and more damaging than the one it went on during the dot-com bubble:
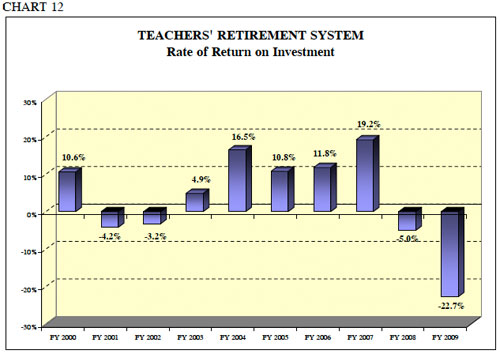
That’s from a 2009 report from the state’s Commission on Government Forecasting and Accountability (PDF; the numbers are a bit hard to read, but they cover the fiscal years 2000-2009).
Note the wild swing that occurred between 2007 and 2009. That won’t happen again… right?
So the market is one thing you have to account for when forecasting. Then there’s active employees (who pay into the system) versus retirees (who receive money from the system). This isn’t a good look:
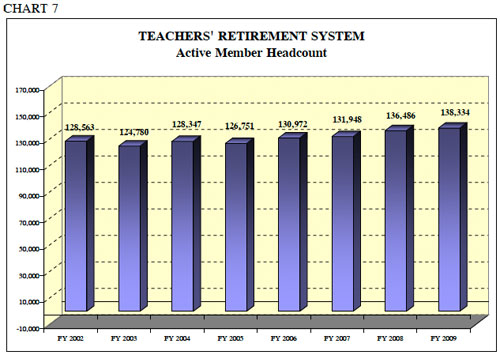
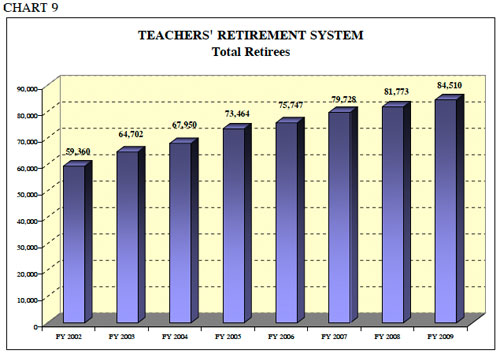
In short: still more active teachers (defined as "full and regular part time"; if you want to drill down even more, the TRS’s past four actuarial reports are here) than retired ones. But the ratio is getting worse.
For your benefit and mine, I’ll skip salary change over time; state funding levels; state pension holidays; the effects of borrowing; early retirement; and many other things I can only dimly remember or am completely ignorant of.
Oh, and all the other pension systems in the city and state.
All this has been a very roundabout way of saying that when you see numbers for pension shortfalls or liabilities, the math behind it is really complex, with a lot of moving parts. And that math is established by legislators who have to answer to voters like me: largely ignorant, only occasionally inclined to be fair, almost certainly derelict in their own retirement planning, likely influenced by the prevailing ideological winds, and from election to election or generation to generation just as likely to demand something different, if they still live here or aren’t dead.
And honestly, it makes me a little more sympathetic to our parade of legislators, ambivalent fellow citizens, and my own slack-jawed confusion with the article that inspired this research, even as it makes me pretty queasy.
PS: Suggested reading on pensions: While America Aged by Roger Lowenstein.