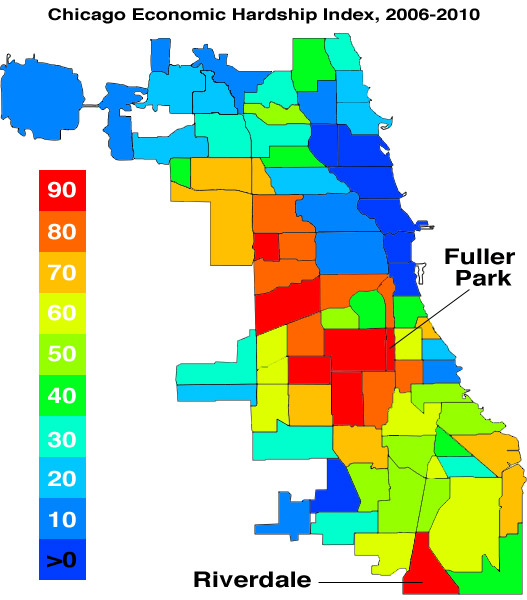
The City of Chicago recently released a rich set of socioeconomic and health data (h/t David Eads) to its Data Portal, courtesy of the Department of Public Health. It covers a range of indicators from the past decade, everything from gonorrhea rates to lead levels to causes of death to employment rate, broken down by community area. One of the more interesting sets is a series of socioeconomic indicators, which are then run through an equation to get a "hardship index." It's a combination of the following:
* Percent of crowded housing
* Percent of households below poverty
* Unemployment rate, 16+
* Percent aged 25+ without a high school diploma
* Percent aged under 18 or 65+
* Per capita income
The community area with the highest hardship score—indexed for the city—is Fuller Park on the south side, at 98. It has the second-highest percentage of households below the poverty line (55.5 percent), the highest unemployment rate (40 percent), and the second-lowest per-capita income ($9,016, one of only two Chicago community areas with a per-capita income below $10,000). Just behind it is Riverdale on the far south side, with the highest percentage of impoverished households (61.4 percent), the fourth-highest unemployment rate (25.2 percent), and the lowest per-capita income ($8,535).
The lowest hardship score? One, for the Near North Side. It actually fares slightly worse than its neighbors in the Loop and Lincoln Park on most metrics, with a 13.4 percent poverty rate (compared to 11.1 and 11.8), unemployment (5.2 versus 4.2 and 4.5), crowded housing (2 percent versus 2 and 0.6 percent), but it has far and away the highest per-capita income in the city: $87,163, almost $16,000 higher than Lincoln Park and almost $20,000 higher than the Loop. Only four Chicago community areas have per-capita incomes over $60,000, the last being the Near South Side, which comes in at just $500 over the bar.