It pains me to admit this as a Cardinals fan, but here goes: The Cubs are a better team right now. Over the past month, the Cubs have astonishingly earned the distinction of the best team in baseball. After a mediocre start, the team truly solidified in the second half of the season, ending with a winning percentage just slightly lower than that of the Toronto Blue Jays.
The Cardinals, meanwhile, are a 100-win team this year. But consider that record with an asterisk. As Ben Lindbergh, a staff writer at Grantland, thoroughly argued this past August, the Cardinals were historically lucky for much of the season. They stranded runners on base at the highest rate in modern baseball history (81.5 percent of the opponents they faced were left on base at the end of an inning). What's more, when opposing teams had runners in scoring positions, opponents' batting averages dropped 60 points (.257 vs .193). Translation: The team's pitchers went from very good to elite when there were runners in scoring position, and there's no evidence (either historical or direct) that pitchers can just do that. So it gets filed under "cluster luck."
Think of it this way: if a team gives up nine hits in a game, that's not great. If they give up all nine hits in one inning, they'll most likely give up a bunch of runs as well, since more hits means more people on base and able to score. But if they give up one hit per inning, they might not give up any runs at all. The Cardinals' cluster luck for defense was more than twice as good as any team in baseball. (The Cubs were one of the unluckiest teams in baseball this season by that measure—and yet, they made it this far.)
Also consider that the Cubs were remarkably healthy this season, while the Cardinals lost their best pitcher (Adam Wainwright), best hitter (Matt Holliday), and most valuable player (Yadier Molina, one of the best defensive catchers and game managers of his generation) for large chunks of the season due to injuries. All three have returned just in time for the playoffs, but no one knows how effective they'll be. So how do the two teams match up, player by player?
Let's begin with the starting rotation. Here are the Cubs—during the second half of the season—as measured by three advanced pitching metrics: fielding independent pitching (FIP), expected fielding independent pitching (xFIP), and skill-interactive earned run average (SIERA). All three are designed to isolate pure pitching ability from other variables. (All numbers via Fangraphs, a baseball statistics site. For the uninitiated, lower is better.)
FIP, xFIP, and SIERA for Cubs starting rotation from July 17 to October 4, 2015
.png)
And here are the Cardinals.
FIP, xFIP, and SIERA for Cardinals starting rotation from July 17 to October 4, 2015
.png)
What you're looking at is basically an estimate of how many runs a pitcher will give up over the course of nine innings, separate from fielding and other factors. And the Cubs easily beat out the Cards. It's not just that the Cardinals can't match up against Arrieta and Lester; Hendricks is competitive with Jaime Garcia, and Hammel is pitching better than Michael Wacha, who has been much worse in the second half of the season. The Cubs' pitching depth has been mentioned as a weakness, but Hendricks has been pitching well and the Cardinals' injuries negate that advantage. (The Cardinals probably have a slightly better bullpen, and they'll need it.)
Things look even better for the Cubs on offense. Again, here are the two teams' possible starters by the Weighted Runs Created Plus (wRC+) metric—a measure of a player's total offensive value—during the second half. Again, numbers courtesy of Fangraphs.
Weighted Runs Created Plus for Cubs players from July 17 to October 4, 2015
.png)
Weighted Runs Created Plus for Cardinals players from July 17 to October 4, 2015
.png)
The numbers here show the average runs created by a player compared to the league average (100). So for a wRC+ of, say, 120, the player in question created 20 percent more runs than the league average.
And yikes. The Cubs have six hitters around 120 wRC+, meaning the total offensive value added (the higher number is better here). The Cardinals have three players above that, and four hovering around 80 wRC+.
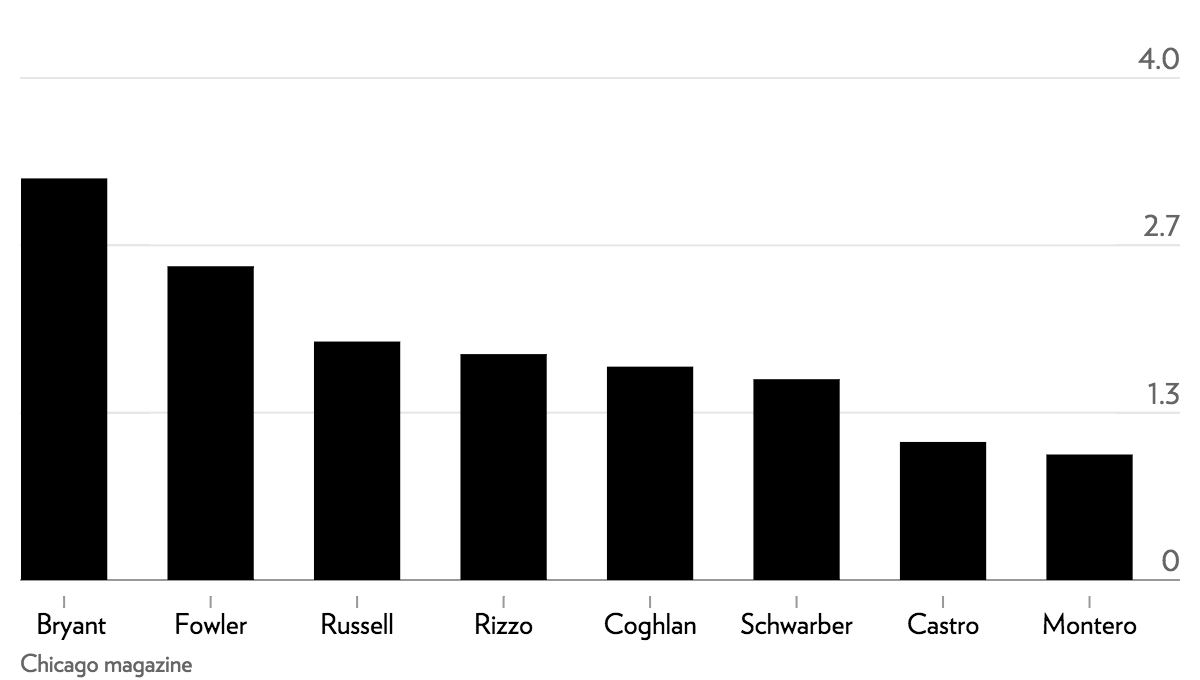
Here's another metric: Wins Above Replacement, which includes defense and base running as well as offense.
Cubs players' Wins Above Replacement for July 17 to October 4, 2015
Cardinals player's Wins Above Replacement for July 17 to October 4, 2015
.png)
Wins Above Replacement is a quick way to study a player's total contribution to his team—basically, how many wins the player contributed over the season over a replacement player. Since WAR includes defense, Heyward, one of the best outfielders in baseball, comes out on top, but it's clear that the Cubs have an advantage here.
I'm not the only one looking at these stats, either. Sahadev Sharma points out at Baseball Prospectus, a baseball analytics website, that this is a tale of two halves of the season, and that's why he picks the Cubs. Ben Humphrey of Viva El Birdos—the Cardinals' site at SB Nation—does the same thing, and also gives the Cubs an edge.