 |
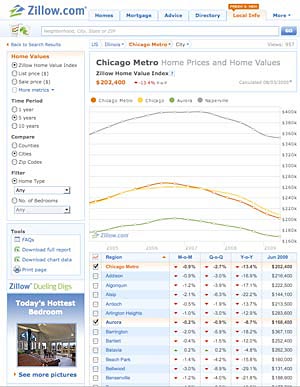
On Tuesday, Zillow.com released its latest round of quarterly fitness reports for the residential real-estate market. It’s an intricately detailed look at home values in cities across the country from March to May of 2009. Visitors to the site can zero in on individual Chicago suburbs and neighborhoods within the city.
It’s not a pretty picture: home values for the region were down 13.9 percent from a year before. But the advantage of the Zillow site is that you can break it down to a complete portrait of what’s been happening near you. As an example, how many houses were sold at a loss in Elmhurst during the quarter? Download the full report on Elmhurst and you have the answer: 23.56 percent of the sales went at a loss, up 8.54 percent from a year before, but down 5.28 percent from the prior quarter. You can also learn other facts about Elmhurst (and other towns). For instance, the median value of homes in Elmhurst, per square foot, dropped 4.9 percent in a year. It’s also possible to drill down and look at how three-bedroom homes fared there, or compare condos to single-family homes.
When you can’t figure out what some columns of data are about, get an explanation here. And not every type of data is available for each town and neighborhood; Zillow has left blank those boxes where it doesn’t have enough information. Zillow’s data, by the way, is about the value of all homes in an area, not only those that have sold recently.
Because Zillow culls foreclosures and short sales from the herd (reporting that information separately), its data might be a better representation of current house values than other reports. “Our intent is to give buyers and sellers some notion of the fair market value of their homes, assuming the home is sold in a voluntary transaction,” says Stan Humphries, Zillow’s chief economist. “We [see] two distinct markets: forced sales or distressed sales, and nonforced sales.”
Humphries does note that, for some home-price indices—such as those from Case-Shiller and the Federal Housing Finance Agency—it makes sense to include foreclosures. “But if the purpose is to give an idea of what home prices have done in voluntary transactions, that’s not needed,” he says. (Where numerous foreclosures have contributed to declining house prices in particular neighborhoods and towns, that impact will be reflected in the reported values of nonforced sales.)
While there have been some recent reports that real estate may be on the rebound, Humphries remains skeptical. “My sense is that our exuberance may be outpacing empirical data right now,” he says. “There are still substantial risks.” They include continuing job losses, and a concern that, when the federal $8,000 tax credit runs out, demand for housing will drop again. “We likely have a nontrivial amount of pent-up supply waiting to get into the market from people who have wanted to sell their homes but haven’t wanted to get into the market of the past two years,” Humphries adds.