Graphic: Courtesy of MRED LLC
The most precise local housing market data for the first half of the year arrived Tuesday, and it’s full of good news. Foreclosures and short sales are taking up less room in the market, the gaps between what sellers think they can get for their homes and what they can actually get is narrowing, prices are up, birds are singing, and rainbows are shining.
The report, produced by Midwest Real Estate Data LLC, shows that in the first six months of the year, the Chicago-area real estate market’s recovery finally kicked in for real—even if it came many months behind the recovery in several other big cities.
Here are some of the most significant improvements the data showed:
• Lots, lots more conventional, non-distressed homes sold in June 2013 than in June 2012. MRED reports that 7,998 conventional homes sold in the region in June; that’s a little over 30 percent more than sold in June 2012. May had been even better: there were 39 percent more conventional sales than in May 2012.
And they sold faster. The average time on the market for home sold in June was 96 days, or about two-thirds what it had been a year before. June was also the first time market time on conventional homes dropped below 100 days since at least the beginning of 2012. The peak was February 2012, when the average market time for a conventional home was 195 days.
• The big uptick in conventional sales also means that foreclosures and short sales—distressed properties—are loosening their stranglehold on the for-sale market. In January, they represented 49 percent of all homes sold (35.4 percent were foreclosures, and 13.6 percent were short sales). But in June, they were just 28.6 percent (18.6 percent foreclosures, 10 percent short sales). That is, they’ve dropped from being almost five out of every ten sales to being fewer than three out of ten.
Why does that matter? It means that in many neighborhoods, sellers have been able to stop looking down the block at the local foreclosures they were competing with. The distressed homes were pulling down prices of conventional homes. With the proportion of conventional homes at, 71.2 percent, its highest level since the beginning of 2012 (the earliest data available), the real estate market in June was being driven much more by conventionally sold homes than it had in a long time.
The caveat: MRED’s data shows that June 2012 was also the high point for conventional sales that year. They were 66.09 percent of sales in June; after that, their share shrank every month through February. CoreLogic reported last week that 8.7 percent of Chicago-area mortgages were in serious delinquency in May, the most of any city; if a large number of those end up foreclosed, we could see the share of distressed sales rising again.
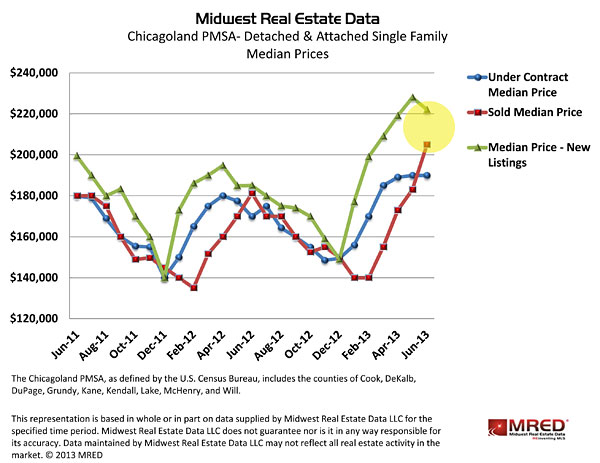
• Sellers, who had been trying hard to pull prices up by starting with ambitious asking prices, have backed off a little bit. In the chart above, the green line is what people are asking for their homes and the red line is what they’re getting; you can see that the gap has narrowed. A few months ago, I was worried by the expanding space between those two lines. In June, sellers got the message and cooled their jets a little—with no negative consequences on the sale prices, which kept rising, as you can see highlighted in yellow.
• About those prices. While the FNC Index that came out Monday said Chicago’s prices have declined 0.2% since the start of the year, MRED’s data shows movement in the other direction. For all homes, distressed and not, MRED’s data shows prices in June were 8.3% above June 2012.
Taking conventional homes by themselves, MRED says prices were 2.7 percent over June 2012. That’s healthy, though it doesn’t put us on par with the craziness in cities like San Francisco and Las Vegas, where prices have notched annual increases of more than 20 percent.
That’s okay, though. At least the birds are singing again.