Chicago’s been changing a lot in the 2000s—we’ve changed mayors, gotten lots of new bike-lane mileage, and lost Oprah. A recent study of housing types shows that some of our neighborhoods have changed in big ways, too.
Among them: a noticeable shift from homeownership to rental in Lincoln Park and Lake View; a divergent home-value recovery, with a few hot neighborhoods speeding ahead while others languish; and single-family home prices in some neighborhoods that put buying a house nearby out of most renters’ reach.
These are all charted in a report that DePaul University’s Institute for Housing Studies put together for city officials last spring as background data for the city’s 2014–2018 housing plan. IHS released the plan publicly in October.
Some of the ways it shows neighborhoods changing since 2000 are:
-
About 5,000 households in Lincoln Park and Lake View that were owned in 2007 were four years later occupied by renters. That’s about six percent of the 81,000 households in those neighborhoods. Geoff Smith, IHS’s executive director, believes that the bulk of this is condos or houses whose owners rented them out after moving to new homes. (See the chart here.*)
“People who bought a condo in 2005–2006, something happened in their lives and they needed to move,” Smith says. That could have been having kids, getting a new job, or wanting to buy a new place while prices were low. “They didn’t want to sell because they owed more than it was worth, and there’s high rental demand, so that became a rental.”
Recovering prices could mean that a lot of those rentals get sold and revert to homeowner-occupied properties.
-
That process may already be starting; prices in those blue-chip neighborhoods have been healing. Tracking home prices through the second quarter of 2013, IHS found that in hot neighborhoods with the least foreclosures, prices are down 17 percent from their boom-years peak, while in the hardest-hit neighborhoods, prices are down 58 percent.
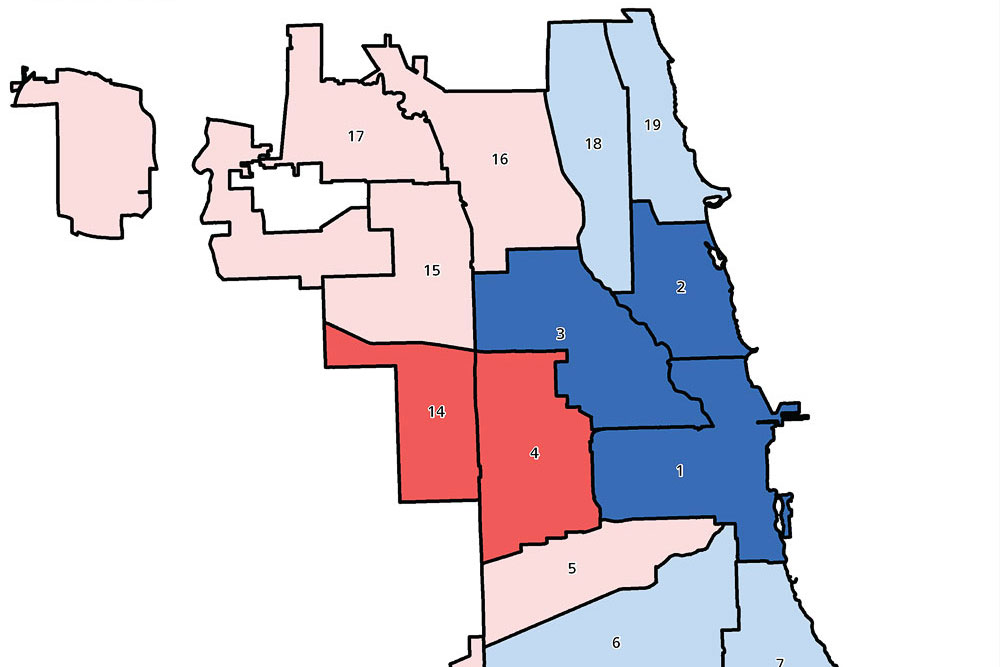
A map in the October report depicts this unevenness glaringly. At the end of 2012, prices were up more than 30 percent from where they’d been in 2000 in a cluster of three city regions—Loop, Lake View/Lincoln Park and West Town/ Logan Square. (In all of these references, IHS is talking about a city region that is larger than the area you might typically think of as the neighborhood.) Prices had gone the opposite direction—they were down more than 30 percent after 12 years—in four regions, two on the West Side and two on the South Side. They’re Garfield Park/Humboldt Park and Austin; and Chatham/Woodlawn/South Shore and South Chicago/Hegewisch. (See the map here.*)
-
There are neighborhoods where making the transition from renting to owning a house may mean having to find a new neighborhood to live in. Top of the list again is Lake View/Lincoln Park, where just four percent of current renters could afford the median-priced house, at $840,000. And even though the median house price in Uptown/Rogers Park is only about half that at $422,500, it’s the second-hardest region of the city for renters to buy houses; only 4.9 percent can do it.
Smith notes that both regions are dense with condos, whose lower prices might put them within renters’ reach. But transitioning into a house while staying in a familiar neighborhood “is a challenge,” he said.
More than 80 percent of renters could afford to buy in the more-troubled city sectors Pilsen/Little Village, Englewood/Auburn Gresham, South Chicago/Hegewisch, and Roseland/Pullman. They all have median prices well below $50,000. But renters there “may not be interested,” Smith says. “These may be properties that have been distressed and vacant. They may need extensive rehabilitation, so they may not be appropriate [purchases] for a renter who’s not an experienced redeveloper.”
- Jefferson Park/Edison Park lost 4,351 homeowner households, the second-biggest loss in the 2007–2011 study period, but without the accompanying increase in renter households that Lincoln Park/Lake View saw. Renting did increase, but a net of about 2,000 households (or an estimated 3,800 people) appear to have left that northwestern part of the city.
- How many of them moved down to hot West Town/Logan Square, do you think? In the same four-year period, there was a gain of 3,094 new households (5,800 people) in that region. I dubbed it the “epicenter of hipness” on Bob Sirott and Marianne Murciano’s WGN Radio show last week.