For many years, Chicago has published an estimable amount of public data. But as seamless as the city's made it to acquire the data, using it has required some expertise. For example, getting crime data for a ward or community area is easy because the data is categorized that way, but getting it for a neighborhood requires at least modest skills with geocoding (and lots of time, depending on how modest your skills are).
Last week, the city debuted what it hopes will make that process easier: OpenGrid. It's an interface for the city's open data that allows users to run their searches off a map, creating their own geographies as they go and mashing up data as they wish.
Before this, members of the city's open-data community had responded to data difficulties by creating nifty tools: The legendary Chicagocrime.org, featured at MoMA in 2008, was created over a decade ago. It's been followed by the ClearStreets snowplow tracker, the Million Dollar Blocks incarceration mapper, the Foodborne Chicago food-poisoning tracker, and many other experiments and projects.
OpenGrid started with WindyGrid, says Brenna Berman, the city's chief information officer. WindyGrid was created in 2012 under then-chief data officer Brett Goldstein as an internal hub for city services. "It's all about helping the city manager plan events, public safety, parades," Berman says. "It's much easier to do when you can visualize all the assets needed to respond."
With backing from Bloomberg Philanthropies and hosting by the Smart Chicago Collaborative, the city built a public version—OpenGrid—atop Plenar.io, an open-source infrastructure for open data created by a group at the University of Chicago's Computation Institute, headed by Goldstein and Charlie Catlett (who's also behind the Array of Things environmental-sensor network).
The new interface still requires some care, but it greatly simplifies the process. "Lots of people, the neighborhood that they recognize is not in their ward or community area," Berman says. "The polygon that I'd draw crosses two wards and community areas. These formal things are not where we live."
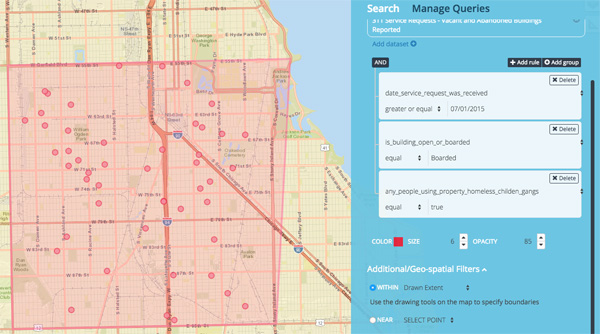
So let's say I wanted to find all the 311 service requests since July 1 of last year for abandoned buildings that are both boarded up and that are being used ("e.g. homeless, children, gangs"), across a swath of the South Side that crosses several wards and community areas. These are problem buildings, or at least ones that we can surmise are problems from the data. I can check how to phrase my conditions through the city's data portal, add the conditions, and boom:
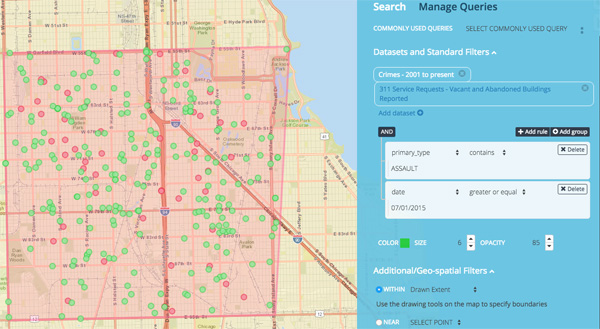
Neat. But you can add even more data. Like, say, all the assaults recorded by CPD since July 1 of last year. First I have to check how the CPD data is categorized by looking here, but then I can easily add a new condition.
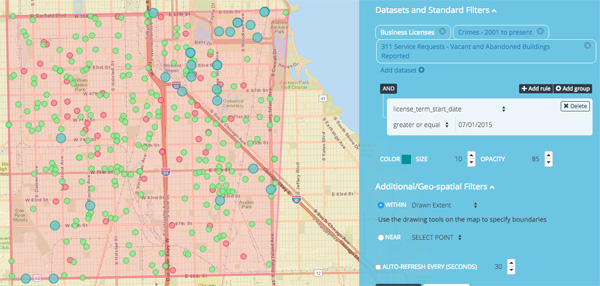
Let's try one more: the start date of business licenses, beginning July 1 of last year. They're the big dots in teal.
There's still a bit of a learning curve, but at best, this would take me a day or two to do outside OpenGrid. Now I can skip the infernal geocoding and concentrate on the data I want and the city I know.