
A lot of different data sets get used to report rent prices in a city. Apartment-listing and real estate sites promote widely shared lists; the government has a couple different ways of going about it, through the Department of Housing and Urban Development and the Census. Daniel Kay Hertz has a nice evaluation of the pros and cons of these data.
There's no perfect way of going about it, but the private-listings data tend to self-select for apartments listed on their services, which tend to be in pricier neighborhoods, so their numbers can look unrealistically high for bargain-hunters like me. Hertz shows one map putting the median one-bedroom apartment in Chicago in February 2016 at $1,940 a month.
Very few lists capture data from the place where lots of us go apartment hunting: Craigslist.
On one hand, it's an incredibly rich data source for what people actually pay for rent. On the other hand, it's an incredibly messy data source. So two researchers at Berkeley, Geoff Boeing and Paul Waddell, scraped and cleaned 11 million listings from all over the country for three months in 2014. And what they found seems to line up with what we know about Chicago.
One caveat: their numbers are for metropolitan statistical areas, which are huge regions that can cover multiple large and very different cities. Seattle's MSA, for example, includes both Seattle (median gross rent per U.S. Census: $1,266) and Tacoma ($980).
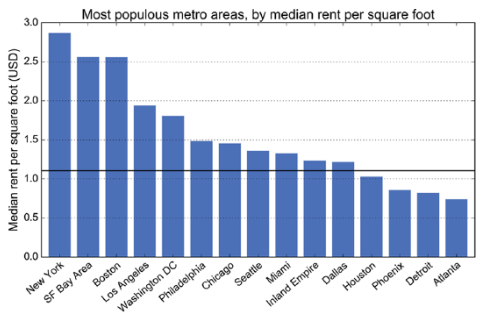
The Chicago region shows a curious pattern. It has a relatively high median rent per square foot, especially compared to Sunbelt cities, but it's still considerably less than the cities that are known to be expensive. (Seattle proper is likely more expensive than Chicago proper, but again, these are metro areas.)
So the rent burden is also on the higher end for big metro areas.

Here's the surprise. Chicago's in the second tier of metro areas when it comes to apartment cost per square foot and rent burden (7th and 6th, respectively). But it's behind only Boston and New York, much more expensive cities, for the availability of cheap apartments as defined by the "fair market rent" level.

"Fair market rent" is a number calculated by the Department of Housing and Urban Development that is the 40th percentile of rent prices based on its own data (i.e., 60 percent of apartments in the area are more expensive than this number). Hertz has a good explanation of FMR, if you want to learn more.
The authors found that, across the entire United States, 37 percent of Craigslist listings were below HUD FMR for the country, meaning that, on the whole, HUD did a pretty good job with its estimates. But in some cities, there appear to be few units for rent below that city's HUD FMR. In Chicago, HUD's FMR for 2018 is $1,014 for a one-bedroom apartment and $1,794 for a four-bedroom. The Craigslist data shows that just sixteen percent of Chicago-area apartments are below that level.
They list some reasons for this, a couple of which Hertz touches on: The FMR calculation tends to be behind the market and extrapolates from Census estimates, so it can be slow to capture rapidly changing markets like Chicago. (As the authors note, Craigslist postings are advertised rent, not necessarily paid rent, so that's another factor.)
Still, Chicago's ranking comes as a surprise. It reminds me of something I found when I was looking at Chicago rents using American Community Survey data:
And the spectrum of median apartment rents in Chicago is, relatively speaking, pretty narrow. There aren’t a lot of census tracts with rents below $600 or above $1,700. The median rents in the tracts surrounding my last apartment—a small three-bedroom that was $1,130 with heat in a great neighborhood—run from about $900-$1,100. In the heart of Englewood, it’s about $670-$750.
In short, the floor for rents in Chicago is pretty high; it’s hard to find a genuinely cheap apartment if you don’t make much money. (The ACS estimates don’t capture subsidies, but there are a lot of people on that waiting list in Chicago.) Conversely, the ceiling is pretty low; you can pay a lot of money, but you don’t have to, so if you’re upper-middle-class, it’s easy to find a place that gives you a comfortable cushion for everything else.
Why are Sunbelt cities so affordable? Back in 2007, Edward Glaeser and Kristina Tobio found that "since 1970, the greater expansion of Southern housing supply has been particularly important. We estimate that housing supply was increasing by at least 20 percent more in the South than elsewhere in the country in the 1970s and 1980s…. [O]ur estimates suggest that faster housing supply growth in the South has been as big a factor as economic productivity in driving the rise of Sunbelt population."
Why is Chicago so (comparatively) expensive, given that parts of the city have seen substantial population losses—which means, theoretically, increased housing supply? The Tribune's Gail MarksJarvis had a good piece on this last year: The housing bubble wiped out a lot of rental landlords—particularly small two- to four-flat owner/landlords, a building size that represents much of Chicago's affordable housing—while simultaneously creating a lot more renters. Then in the aftermath of the recession, lending got extremely tight. Meanwhile the condition of the apartment buildings declined, making them more expensive to rehabilitate.
The result is a region that's both affordable and not: For residents who make a decent salary, it offers good housing at rates favorable to other desirable regions. For those who don't, a high floor on rents makes them more likely to seek more affordable cities, pushing population decline where the city can least afford to lose more people.